- My Forums
- Tiger Rant
- LSU Recruiting
- SEC Rant
- Saints Talk
- Pelicans Talk
- More Sports Board
- Fantasy Sports
- Golf Board
- Soccer Board
- O-T Lounge
- Tech Board
- Home/Garden Board
- Outdoor Board
- Health/Fitness Board
- Movie/TV Board
- Book Board
- Music Board
- Political Talk
- Money Talk
- Fark Board
- Gaming Board
- Travel Board
- Food/Drink Board
- Ticket Exchange
- TD Help Board
Customize My Forums- View All Forums
- Show Left Links
- Topic Sort Options
- Trending Topics
- Recent Topics
- Active Topics
Started By
Message
re: 11 day difference between Italy and the US
Posted on 3/13/20 at 2:22 pm to X123F45
Posted on 3/13/20 at 2:22 pm to X123F45
What with 5x the population and the same general incident rate we are doing better? Wow, logic like that won't last long because this is going to kill us all. That reminds me I need to buy more toilet paper...
 0
0

Posted on 3/13/20 at 2:25 pm to Antonio Moss
quote:
If one country starts at 2 per 100,000 and the second starts at 10 per 100,000 after ten days country number one is 1024 per 100,000 and country two would be at 5,210 per 100,000.
That’s five times the infection rate.
Transmission is not on a per capita model, unless you're assuming that at the outbreak, there were X number of carriers per capita.
In a true patient 0 situation, population density matters way more than total population.
Posted on 3/13/20 at 2:26 pm to LNCHBOX
I wonder what the testing frequency per person is here vs there.
My suspicion is that the US tested way less than over there.
My suspicion is that the US tested way less than over there.
This post was edited on 3/13/20 at 2:28 pm
Posted on 3/13/20 at 2:29 pm to StringedInstruments
Rework the numbers in a percentage weighing in population.
Posted on 3/13/20 at 2:29 pm to StringedInstruments
12,462 people out of 60,500,000 is 0.0002
Posted on 3/13/20 at 2:31 pm to Capital Cajun
quote:
Rework the numbers in a percentage weighing in population.
That would only work if we gave out the same number of tests that they did.
Posted on 3/13/20 at 2:34 pm to RT1941
quote:
Damn, the US is doing much better than Italy with this virus when comparing the population density of the two countries.
Us population density, 93 people per square mile. Italy population density is at 532 people per square mile. It's as lopsided as the population difference is, just the opposite direction.

Posted on 3/13/20 at 2:34 pm to UpToPar
quote:
Transmission is not on a per capita model, unless you're assuming that at the outbreak, there were X number of carriers per capita.
In a true patient 0 situation, population density matters way more than total population.
Of course,
My point was simple. In terms of important things like healthcare capacity (which is the problem in Italy) per capita infection rates are incredibly important.
ETA: and, in fairness, looking at this on national level isn’t very helpful given the regional nature of healthcare.
This post was edited on 3/13/20 at 2:37 pm
Posted on 3/13/20 at 2:45 pm to heatom2
quote:
I'd like to see #s of tests run compared to Italy. We have many more people infected than the number posted.
Data is a few days old
https://www.businessinsider.com/coronavirus-testing-covid-19-tests-per-capita-chart-us-behind-2020-3
Posted on 3/13/20 at 2:48 pm to StringedInstruments
there are two strains.
i would hope they track both and who all dies from each.
anecdotal that people are just a couple days with variation2 and deaths door with original.
i would hope they track both and who all dies from each.
anecdotal that people are just a couple days with variation2 and deaths door with original.
Posted on 3/13/20 at 2:49 pm to Cosmo
quote:Exactly 4 apart per day on the first two days....
That graph is a perfect example of manipulating statistics and making a graph to try and prove a point
Then... whoops, can't be that close. Let's mix it up a bit.
So obvious.
Posted on 3/13/20 at 2:57 pm to X123F45
quote:
Given our massive difference in population size and makeup oh, we're doing pretty well
Until you realize our numbers are so small because we haven’t been adequately testing.
Posted on 3/13/20 at 2:59 pm to bigpapamac
has italy's colder weather been discussed? I thought heat affects the life of the virus? We're in 80's, italy been in like 50's-60's.

Posted on 3/13/20 at 3:00 pm to RedPop4
quote:
Anyone else see that speculation/analysis?
It's not really speculation, it's the same for California and Washington here in the states.
Posted on 3/13/20 at 3:04 pm to OldSouth
Which implies our peak may be higher. That is small sourced exponential growth. Most initial accelerations look similar.

Posted on 3/13/20 at 3:04 pm to bigpapamac
quote:
Until you realize our numbers are so small because we haven’t been adequately testing.
So the death rate is wayyyyyyy out of proportion and this is being highly politicized. Makes sense.
Posted on 3/13/20 at 3:05 pm to Capital Cajun
quote:That's not how R0 works.
Rework the numbers in a percentage weighing in population.
Posted on 3/13/20 at 3:06 pm to StringedInstruments
We are going to have way over 12,000 people with the virus by March 22.
But we won't have as many deaths.
But we won't have as many deaths.

Posted on 3/13/20 at 3:07 pm to BlackPawnMartyr
quote:
So the death rate is wayyyyyyy out of proportion and this is being highly politicized. Makes sense.
Not exactly. You can assume that deaths due to the disease are not being caught since they didn't know the person had it as well.
Posted on 3/13/20 at 3:07 pm to StringedInstruments
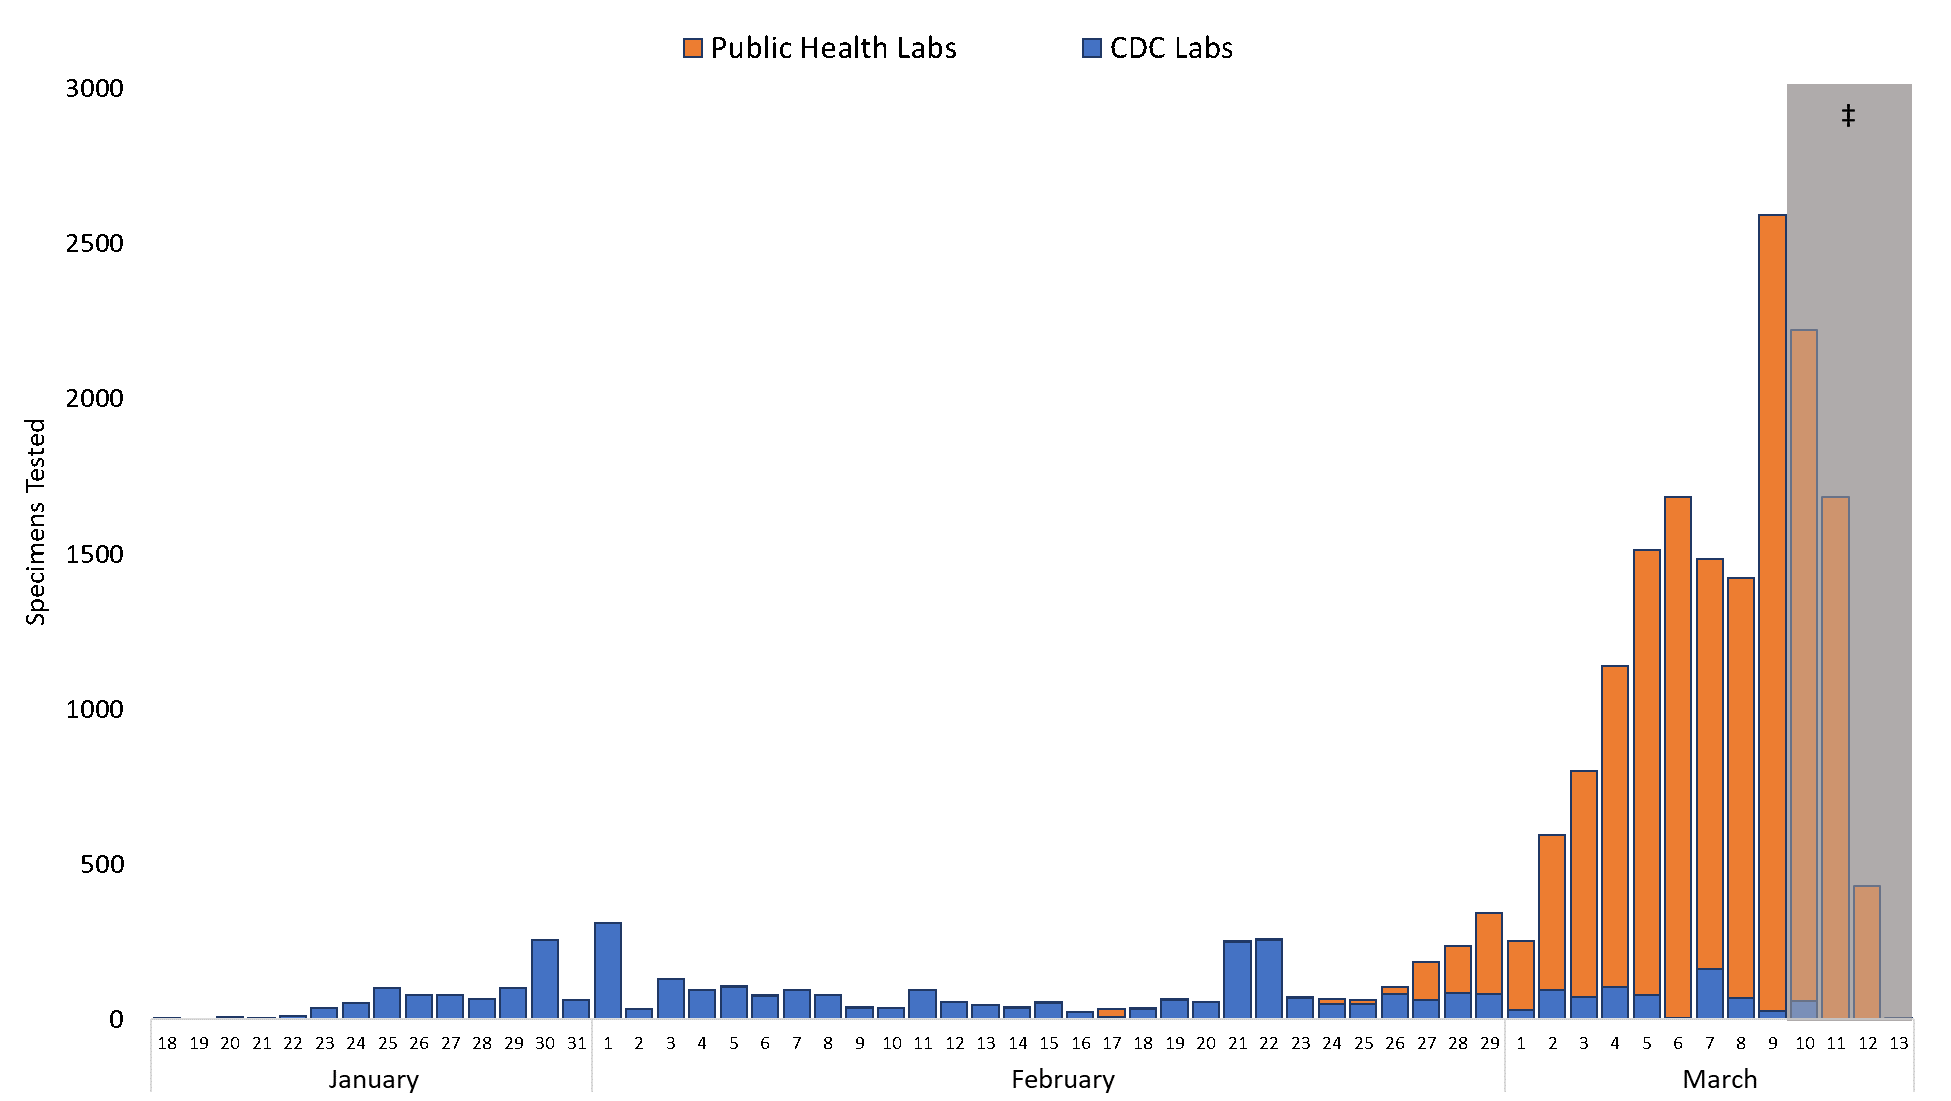
We also had a huge increase in testing towards end of Feb and into March once state public labs started testing for it.
Date CDC Tests / States Tests
1/18 CDC 4 / States 0
1/19 CDC 0 / States 0
1/20 CDC 7 / States 0
1/21 CDC 3 / States 0
1/22 CDC 10 / States 0
1/23 CDC 36 / States 0
1/24 CDC 53 / States 0
1/25 CDC 101 / States 0
1/26 CDC 79 / States 0
1/27 CDC 77 / States 0
1/28 CDC 65 / States 0
1/29 CDC 102 / States 0
1/30 CDC 256 / States 0
1/31 CDC 63 / States 0
2/1 CDC 310 / States 0
2/2 CDC 33 / States 0
2/3 CDC 131 / States 0
2/4 CDC 93 / States 0
2/5 CDC 104 / States 0
2/6 CDC 74 / States 1
2/7 CDC 93 / States 0
2/8 CDC 79 / States 0
2/9 CDC 36 / States 2
2/10 CDC 37 / States 0
2/11 CDC 95 / States 0
2/12 CDC 56 / States 0
2/13 CDC 47 / States 0
2/14 CDC 36 / States 4
2/15 CDC 51 / States 3
2/16 CDC 24 / States 0
2/17 CDC 7 / States 26
2/18 CDC 32 / States 2
2/19 CDC 63 / States 3
2/20 CDC 55 / States 0
2/21 CDC 249 / States 1
2/22 CDC 255 / States 3
2/23 CDC 67 / States 2
2/24 CDC 50 / States 13
2/25 CDC 50 / States 11
2/26 CDC 80 / States 23
2/27 CDC 62 / States 109
2/28 CDC 86 / States 144
2/29 CDC 80 / States 252
3/1 CDC 31 / States 198
3/2 CDC 94 / States 477
3/3 CDC 73 / States 688
3/4 CDC 105 / States 995
3/5 CDC 78 / States 1338
3/6 CDC 5 / States 1438
3/7 CDC 137 / States 1162
3/8 CDC 46 # States 1102
3/9 CDC 20 # States 1369
3/10 CDC 23 # States 350
3/11 CDC 0 # States 5
subtotals 3903 9721
Combined 13624
# incomplete data as of posting
Coronavirus Disease 2019 (COVID-19) https://www.cdc.gov/coronavirus/2019-ncov/testing-in-us.html
This post was edited on 3/13/20 at 3:58 pm

 Page 4 of 7

Popular
Back to top