- My Forums
- Tiger Rant
- LSU Recruiting
- SEC Rant
- Saints Talk
- Pelicans Talk
- More Sports Board
- Fantasy Sports
- Golf Board
- Soccer Board
- O-T Lounge
- Tech Board
- Home/Garden Board
- Outdoor Board
- Health/Fitness Board
- Movie/TV Board
- Book Board
- Music Board
- Political Talk
- Money Talk
- Fark Board
- Gaming Board
- Travel Board
- Food/Drink Board
- Ticket Exchange
- TD Help Board
Customize My Forums- View All Forums
- Show Left Links
- Topic Sort Options
- Trending Topics
- Recent Topics
- Active Topics
Started By
Message
 0
0


Posted on 3/28/20 at 7:16 pm to CatahoulaCur
quote:
It’s safe to conclude that all of China’s data is made up.
I agree.
quote:
Zero chance they battled this for 3-4 months with 5-6 times the population of the US and have less cases.
I disagree. They took containment steps that our people refuse to accept and our government will not force.
They locked people in their domiciles and literally sealed the doors on a massive scale. Our people with shelter in place orders are still fricking going to McDonalds.
Posted on 3/28/20 at 7:38 pm to TigerFanatic99
They have been burning bodies in incinerators for 3 months now. And ordered about 40 more. They have a black cloud of death from all the sulfur.
Posted on 3/28/20 at 8:11 pm to TigerFanatic99
So you agree that their data is made up, but disagree that our numbers are higher than their made up numbers?
Does that mean you think China overinflated their numbers and they are actually less than they declared?
Does that mean you think China overinflated their numbers and they are actually less than they declared?
Posted on 3/28/20 at 8:16 pm to CatahoulaCur
Pretty interesting projections in link below. From the get go, I've been saying ~75K-100K US deaths total from this. Link below estimates ~81K currently.
LINK
LINK
Posted on 3/28/20 at 8:21 pm to GeneralLee
We have had a growth rate in deaths at 30+% for the last week. If that were to continue we would be at 87,000 by the end of the next two weeks. This is what concerns me.
Posted on 3/28/20 at 8:29 pm to Chromdome35
This is the link to the COVID-19 tracker that I have shared on Google Drive. Chromdome's COVID-19 Daily Tracker
The source for the data is https://www.worldometers.info/coronavirus/
The source for the testing data is from https://covidtracking.com/data/
On the tracker sheet you will see tabs for the following data:
1) US Summary
2) Country Comparables: This shows you how the US stacks up vs. select other countries dealing with COVID-19
3) Italy Summary
4) UK Summary
5) France Summary
6) Germany Summary
7) US Weighted Averages - Explores 7 day vs 3 day weight average trends
8) Predictive Model - A simple predictive model that shows where the numbers will be in the future if growth rates don't change
9) Logarithmic Comparisons - Shows the US vs the other countries on the tracker.
10) Sweden Summary
If you would like a graph created that I don't have, just ask and if it's possible I will create it for you.
Due to space constraints on the PT board, I'm only posting a few graphs in the thread, if a consensus emerges of what graphs the PT wants to see in thread without having to go to the tracker, I will gladly change them up.
I am working to create a sheet that compares the US metrics to the other countries metrics. I'll let you all know when that's done and available.
NOTE: The daily growth rate data will not be accurate until the end of the day's postings. It will change throughout the day.
NOTE: I am not tracking individual states, I don't have a reliable consistent source for that data.
NOTE: I am not a mathematician, statistics guru, scientist, sharpest tack in the box, I'm just a guy who likes to understand for myself what is happening and to share it with others. This thread was not created to debate if you should or shouldn't take this seriously, it is simply to present the numbers and foster conversation.
Posted on 3/28/20 at 8:32 pm to Colonel Flagg
I don’t understand the downvotes. It hasn’t really spread out of some of the more concentrated areas and we are seeing the number of deaths growing at a high rate.
I am worried about our future daily lives and economy, but the numbers are not showing anything positive imo regarding the virus.
I am worried about our future daily lives and economy, but the numbers are not showing anything positive imo regarding the virus.
This post was edited on 3/28/20 at 8:35 pm

Posted on 3/28/20 at 8:43 pm to Chromdome35
Congrats to our newest recover-ers
Posted on 3/28/20 at 8:46 pm to Chromdome35
Not a good day, I hope this isn't understated as weekends have shown to be.
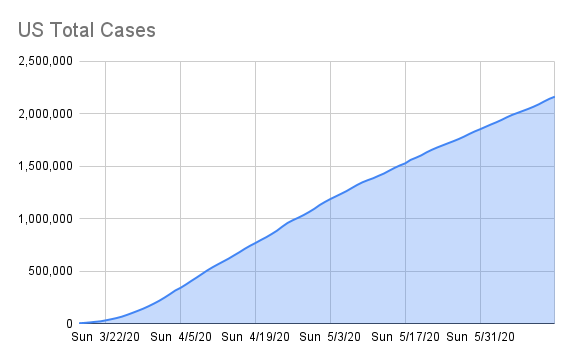
I'll start with the good news, Total cases grew at 18.6%, thats the lowest daily growth rate since this started. This also extends the trend of lowering growth rate tha dates back to the 22nd. We need to move the days to double rate to 5.
Testing appears to be slowing growing by only 1708 above yesterday, are we reaching our peak testing volume?
Unfortunately, the growth rate of deaths shows no sign of slowing and appears to be hovering at around 30%. That means the current number doubles in 3.5 days That puts us in a range of H1N1 death numbers in about 8 days.
Mortality continues to increase and is up to 1.79% I hope this starts to decline soon because the number of positive cases increases along with the increse in testing driving down the mortality rate.
If you look at the graph below, you can see the increasing rate of deaths compared to the number of cases. It is showing an increasing pattern instead of a decreasing one. Not Good.
This post was edited on 3/28/20 at 8:55 pm
Posted on 3/28/20 at 8:55 pm to Chromdome35
The death rate will outpace the new cases rate at this point. The death "wave" is following the new cases "wave." Hopefully the first will peak soon and then we have to wait for the peak of the second. By that time, we will be into the 2nd or 3rd week of April. It sucks, because I am hopeful most of the country is back online by Easter except for the hotspots. Thank you for your work in this thread.
Posted on 3/28/20 at 8:57 pm to NYNolaguy1
I am not bothered by it. I just look at the numbers and give my honest analysis. To each his own.

Posted on 3/28/20 at 8:57 pm to Chromdome35
Doesn’t it make sense if testing has decreased as people are approaching the two weeks of quarantine?

Posted on 3/28/20 at 9:40 pm to LSURussian
quote:Yes. And this thing seems to be far more contagious. It's very difficult to keep it all into scale. 300,000 cases of a horrible flu seems like a lot. But its' ~0.1% of our population (ignoring for them moment that there are probably many, untested cases).
Just think: if we get another 42.7 million confirmed cases after that we'll tie the number of cases of flu in 2018/2019.
We have a long way to go before this is done.
Posted on 3/28/20 at 9:47 pm to GeneralLee
Thanks- I will bookmark this as we track along. Interested to see how close that is to end numbers.
So, do you think China really had 4,000 deaths and we will be closer to 80K AND China has 5 times the population?
If I had to guess, China has had a minimum of 250K people die if we come in at 80K.
So, do you think China really had 4,000 deaths and we will be closer to 80K AND China has 5 times the population?
If I had to guess, China has had a minimum of 250K people die if we come in at 80K.
Posted on 3/28/20 at 9:52 pm to Chromdome35
Anyone know how they are tracking “recoveries”?
Is that people that have left the hospital after treatment, or people that are calling their doctor letting them know that they are 14 days symptom free??
Is that people that have left the hospital after treatment, or people that are calling their doctor letting them know that they are 14 days symptom free??

Posted on 3/28/20 at 10:00 pm to CatahoulaCur
I think the only recoveries at this point are people who are discharging from the hospital with two negative tests. I don’t think anyone else is being tracked.
Posted on 3/28/20 at 10:09 pm to Chromdome35
quote:
If you look at the graph below, you can see the increasing rate of deaths compared to the number of cases. It is showing an increasing pattern instead of a decreasing one. Not Good.
That was a predictable result given the dramatic influx of new cases around 7-10 days ago.
Also, there are multiple locations which are only testing if it changes the patients’ treatment. So that will drive up deaths faster than new cases as well. This is probably less of a factor than the above, though.
Posted on 3/28/20 at 10:13 pm to the808bass
quote:NJ hasn't been reporting any recoveries yet. Unfortunately many test results are up to a 7 day delay again.
I think the only recoveries at this point are people who are discharging from the hospital with two negative tests. I don’t think anyone else is being tracked.
Posted on 3/28/20 at 10:21 pm to the808bass
I’m louisiana they are not. The “state doctor” said in the presser with the mayor that they can’t.

 Page 92 of 331

Popular
Back to top