- My Forums
- Tiger Rant
- LSU Recruiting
- SEC Rant
- Saints Talk
- Pelicans Talk
- More Sports Board
- Fantasy Sports
- Golf Board
- Soccer Board
- O-T Lounge
- Tech Board
- Home/Garden Board
- Outdoor Board
- Health/Fitness Board
- Movie/TV Board
- Book Board
- Music Board
- Political Talk
- Money Talk
- Fark Board
- Gaming Board
- Travel Board
- Food/Drink Board
- Ticket Exchange
- TD Help Board
Customize My Forums- View All Forums
- Show Left Links
- Topic Sort Options
- Trending Topics
- Recent Topics
- Active Topics
Started By
Message
 0
0

Posted on 3/28/20 at 5:38 pm to WylieTiger


Posted on 3/28/20 at 5:42 pm to Kingpenm3
How many of the 773 and 270 yesterday were part of the group of 400 that died yesterday? Helps to understand how many are moving in and out, one way or the other.
Posted on 3/28/20 at 5:46 pm to Chromdome35
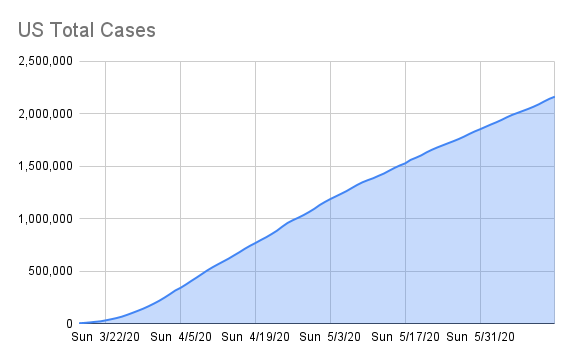
We were looking to see if we topped 100,000 cases by Friday (yesterday), and we did. What are the chances we get to 200,000 by next Friday?
What is the better chance - that we DON'T get to 200,000 cases by next Friday, or that we get to 300,000 cases by next Friday?
What is the better chance - that we DON'T get to 200,000 cases by next Friday, or that we get to 300,000 cases by next Friday?
This post was edited on 3/28/20 at 5:48 pm

Posted on 3/28/20 at 5:47 pm to ConwayGamecock
We are going to get to 200k cases by Wednesday
Or sooner
Or sooner
This post was edited on 3/28/20 at 5:48 pm
Posted on 3/28/20 at 5:48 pm to Tiguar
Sadly, I agree.....
Posted on 3/28/20 at 5:57 pm to ConwayGamecock
How do the worldometer numbers compare the Johns Hopkins numbers?
Posted on 3/28/20 at 5:59 pm to Janky
They track pretty close together, there is always some variation but they aren't too far apart.
I think the variation comes from different update cadences.
I think the variation comes from different update cadences.
Posted on 3/28/20 at 6:01 pm to Chromdome35
So, if active case growth is declining here it should be declining for JH too?
Posted on 3/28/20 at 6:02 pm to Tiguar
quote:Just think: if we get another 42.7 million confirmed cases after that we'll tie the number of cases of flu in 2018/2019.
We are going to get to 200k cases by Wednesday
Posted on 3/28/20 at 6:04 pm to Chromdome35
This is the link to the COVID-19 tracker that I have shared on Google Drive. Chromdome's COVID-19 Daily Tracker
The source for the data is https://www.worldometers.info/coronavirus/
The source for the testing data is from https://covidtracking.com/data/
On the tracker sheet you will see tabs for the following data:
1) US Summary
2) Country Comparables: This shows you how the US stacks up vs. select other countries dealing with COVID-19
3) Italy Summary
4) UK Summary
5) France Summary
6) Germany Summary
7) US Weighted Averages - Explores 7 day vs 3 day weight average trends
8) Predictive Model - A simple predictive model that shows where the numbers will be in the future if growth rates don't change
9) Logarithmic Comparisons - Shows the US vs the other countries on the tracker.
10) Sweden Summary
If you would like a graph created that I don't have, just ask and if it's possible I will create it for you.
Due to space constraints on the PT board, I'm only posting a few graphs in the thread, if a consensus emerges of what graphs the PT wants to see in thread without having to go to the tracker, I will gladly change them up.
I am working to create a sheet that compares the US metrics to the other countries metrics. I'll let you all know when that's done and available.
NOTE: The daily growth rate data will not be accurate until the end of the day's postings. It will change throughout the day.
NOTE: I am not tracking individual states, I don't have a reliable consistent source for that data.
NOTE: I am not a mathematician, statistics guru, scientist, sharpest tack in the box, I'm just a guy who likes to understand for myself what is happening and to share it with others. This thread was not created to debate if you should or shouldn't take this seriously, it is simply to present the numbers and foster conversation.

Posted on 3/28/20 at 6:08 pm to Tiguar
Some Missouri Stats:
838 positive tests
12,385 total tests performed
6.7% positive
10 deaths
Top counties for positive results:
St. Louis County: 313 (37% of total)
Kansas City: 94 (11%)
St. Louis City: 93 (11%)
Boone: 49 (6%)
Jackson: 43 (5%)
Greene: 41 (5%)
St. Charles: 37 (4%)
Interestingly, St. Charles County has a larger population (400k vs 300k) but about 13% the population density of St. Louis City (680 ppl/sq mi vs 5.1k ppl/sq mi). St. Charles has 1/3 the current cases that St. Louis City does. They’re separated by about 15 miles.
So far today, 168 new cases.
Yesterday, 168 new cases.
One new death both yesterday and today.
This post was edited on 3/28/20 at 6:14 pm

Posted on 3/28/20 at 6:19 pm to the808bass
Latest FT international & regional comparison charts (as of about 3 PM).


Posted on 3/28/20 at 6:27 pm to TigerDoc
It’s safe to conclude that all of China’s data is made up. Zero chance they battled this for 3-4 months with 5-6 times the population of the US and have less cases.
ZERO CHANCE
ZERO CHANCE
Posted on 3/28/20 at 6:29 pm to CatahoulaCur
quote:
It’s safe to conclude that all of China’s data is made up.
Yep.
Posted on 3/28/20 at 6:34 pm to CatahoulaCur
I genuinely want to punish china kineticly but I know that’s just my emotions talking and it’s not practical
Posted on 3/28/20 at 6:45 pm to TigerDoc
Thanks for those graphs, TigerDoc. You have one there that gives marks for the deaths, and when certain countries imposed lockdowns.
I think a good graph would be those countries that did impose lockdowns and what the trend of continued cases looked like. Like, did those lockdowns help decline the trend of new cases, or did they have little to no effect? That graph may serve as an indicator of what impact any lockdowns in the U.S. may have in containing the spread.....
I think a good graph would be those countries that did impose lockdowns and what the trend of continued cases looked like. Like, did those lockdowns help decline the trend of new cases, or did they have little to no effect? That graph may serve as an indicator of what impact any lockdowns in the U.S. may have in containing the spread.....
Posted on 3/28/20 at 6:47 pm to Tiguar
Tiguar,
There was a pt a few days back that was going to get chloroquine and azithromycin. How did that ever turn out?
There was a pt a few days back that was going to get chloroquine and azithromycin. How did that ever turn out?
Posted on 3/28/20 at 6:48 pm to WylieTiger
I think we started it too late. There is a push to not start any meds until tests come back positive so we don’t waste drugs but by that time the patient was falling into ARDS. They are in limbo on a vent

Posted on 3/28/20 at 6:57 pm to ConwayGamecock
quote:
We were looking to see if we topped 100,000 cases by Friday (yesterday), and we did. What are the chances we get to 200,000 by next Friday?
Doubling rate is about 2-3 days. So pretty good.
quote:
What is the better chance - that we DON'T get to 200,000 cases by next Friday, or that we get to 300,000 cases by next Friday?
We should be at about 400,000 cases by next Friday.

 Page 91 of 331

Popular
Back to top