- My Forums
- Tiger Rant
- LSU Recruiting
- SEC Rant
- Saints Talk
- Pelicans Talk
- More Sports Board
- Fantasy Sports
- Golf Board
- Soccer Board
- O-T Lounge
- Tech Board
- Home/Garden Board
- Outdoor Board
- Health/Fitness Board
- Movie/TV Board
- Book Board
- Music Board
- Political Talk
- Money Talk
- Fark Board
- Gaming Board
- Travel Board
- Food/Drink Board
- Ticket Exchange
- TD Help Board
Customize My Forums- View All Forums
- Show Left Links
- Topic Sort Options
- Trending Topics
- Recent Topics
- Active Topics
Started By
Message
re: Daily COVID Updated as of 11/2/20 8:00 PM
Posted on 3/29/20 at 12:52 pm to uppermidwestbama
Posted on 3/29/20 at 12:52 pm to uppermidwestbama
Midwest has been doing well
Posted on 3/29/20 at 12:58 pm to tiger91
quote:He doesn't test for the virus. He just hands out prescriptions to everyone.
asked on the other thread about this: how does one family doc see that many positive patients and is that source reliable?
Posted on 3/29/20 at 12:58 pm to LosLobos111
Minnesota data
LINK
17,657 tests performed
503 confirmed
9 deaths
1.79 death rate
There's like 50 counties in MN with zero cases.
LINK
17,657 tests performed
503 confirmed
9 deaths
1.79 death rate
There's like 50 counties in MN with zero cases.
This post was edited on 3/29/20 at 12:59 pm
Posted on 3/29/20 at 12:59 pm to imjustafatkid
quote:NJ doesn't release until 2pm, once a day. NY seems to update a couple of times per day.
330 new cases seems low, even for the first release of the day. Am I imagining that?
Posted on 3/29/20 at 1:02 pm to uppermidwestbama
Posted on 3/29/20 at 1:05 pm to Chromdome35
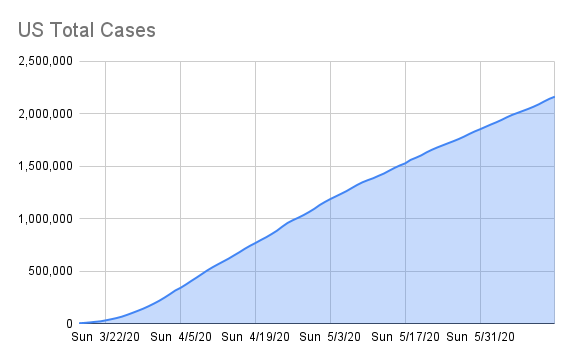
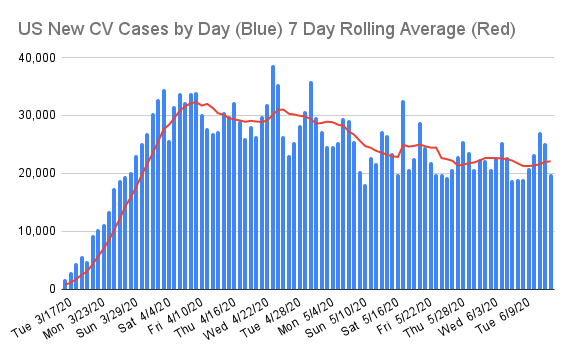
This is the link to the COVID-19 tracker that I have shared on Google Drive. Chromdome's COVID-19 Daily Tracker
The source for the data is https://www.worldometers.info/coronavirus/
The source for the testing data is from https://covidtracking.com/data/
On the tracker sheet you will see tabs for the following data:
1) US Summary
2) Country Comparables: This shows you how the US stacks up vs. select other countries dealing with COVID-19
3) Logarithmic Comparisons - Shows the US vs the other countries on the tracker.
4) Covid Vs Other Outbreaks - Compares the current COVID numbers to the last 10 years of flue and H1N1
5) US Weighted Averages - Explores 7 day vs 3 day weight average trends
6) Italy Summary
7) UK Summary
8) France Summary
9) Germany Summary
10) Sweden Summary
11) World Summary
If you would like a graph created that I don't have, just ask and if it's possible I will create it for you.
Due to space constraints on the PT board, I'm only posting a few graphs in the thread, if a consensus emerges of what graphs the PT wants to see in thread without having to go to the tracker, I will gladly change them up.
I am working to create a sheet that compares the US metrics to the other countries metrics. I'll let you all know when that's done and available.
NOTE: The daily growth rate data will not be accurate until the end of the day's postings. It will change throughout the day.
NOTE: I am not tracking individual states, I don't have a reliable consistent source for that data.
NOTE: I am not a mathematician, statistics guru, scientist, sharpest tack in the box, I'm just a guy who likes to understand for myself what is happening and to share it with others. This thread was not created to debate if you should or shouldn't take this seriously, it is simply to present the numbers and foster conversation.

Posted on 3/29/20 at 1:05 pm to mmcgrath
quote:
NJ doesn't release until 2pm, once a day. NY seems to update a couple of times per day.
This doesnt answer my question. I've been following this thread closely, and I think most early morning drops are much higher than 330. Is that not the case?
Posted on 3/29/20 at 1:05 pm to uppermidwestbama
Posted on 3/29/20 at 1:07 pm to mmcgrath
quote:
He doesn't test for the virus. He just hands out prescriptions to everyone.
Wish there was a doc around here doing that.
Posted on 3/29/20 at 1:07 pm to Chromdome35
I increased the granularity of the days to double numbers by taking it out to one decimal point. I feel like this will give us a better view of the trend in the numbers.

Posted on 3/29/20 at 1:09 pm to Chromdome35
Around 9,500 is about what I was expecting to see this morning.
Posted on 3/29/20 at 1:09 pm to imjustafatkid
quote:There was another day this week where data started off very slow. It seems like the weekends are under reported generally, so it wouldn't be unexpected. The country is at nearly 10k new cases now.
This doesnt answer my question. I've been following this thread closely, and I think most early morning drops are much higher than 330. Is that not the case?
Posted on 3/29/20 at 1:09 pm to imjustafatkid
Given that its the weekend, I wouldn't put much effort into trying to interpret what was posted this morning vs prior mornings.
I ran an average growth rate by day and you can see in the graph below that the weekends run below the rest of the week.

I ran an average growth rate by day and you can see in the graph below that the weekends run below the rest of the week.
Posted on 3/29/20 at 1:10 pm to uppermidwestbama
MI data
LINK
total number of tests performed is not shown
4650 confirmed
111 deaths
Deaths mostly concentrated in the Detroit region from older folks with heath issues
2.3 death rate
LINK
total number of tests performed is not shown
4650 confirmed
111 deaths
Deaths mostly concentrated in the Detroit region from older folks with heath issues
2.3 death rate
Posted on 3/29/20 at 1:14 pm to uppermidwestbama
Posted on 3/29/20 at 1:15 pm to Chromdome35
quote:
I ran an average growth rate by day and you can see in the graph below that the weekends run below the rest of the week.
Sure looks like someone is submitting weekend results on Monday.
Posted on 3/29/20 at 1:19 pm to RougeDawg
Yea, thats what I think too
Posted on 3/29/20 at 1:24 pm to uppermidwestbama
Washington data shows this isn't nearly as scary or deadly as people thought at first. In Washington, where this all started, still has most of their cases in two counties.
LINK /
82 percent of the deaths in that state are from those 70 years of age or older.
54,896 tests performed
4,310 confirmed
189 deaths
4.3 death rate
The death rate in this state is an outlier. Once you get away from the initial deaths since they didn't know what was going on at the time, you see the rest of the state it's not bad.
Washington will turn out to be the outlier in all of this and that is where the panic started in our country.
Posted on 3/29/20 at 1:53 pm to uppermidwestbama
I remember early on how much worse the WA numbers were than anywhere else. They’ve kept things under control impressively after the brutal start.
Posted on 3/29/20 at 4:01 pm to LosLobos111
Deaths per capita USA doing great
Despite what CNN says
Despite what CNN says
Popular
Back to top


 2
2


