




 4
4













- My Forums
- Tiger Rant
- LSU Score Board
- LSU Recruiting
- SEC Rant
- SEC Score Board
- Saints Talk
- Pelicans Talk
- More Sports Board
- Fantasy Sports
- Golf Board
- Soccer Board
- O-T Lounge
- Tech Board
- Home/Garden Board
- Outdoor Board
- Health/Fitness Board
- Movie/TV Board
- Book Board
- Music Board
- Political Talk
- Money Talk
- Fark Board
- Gaming Board
- Travel Board
- Food/Drink Board
- Ticket Exchange
- TD Help Board
Customize My Forums- View All Forums
- Show Left Links
- Topic Sort Options
- Trending Topics
- Recent Topics
- Active Topics
Started By
Message
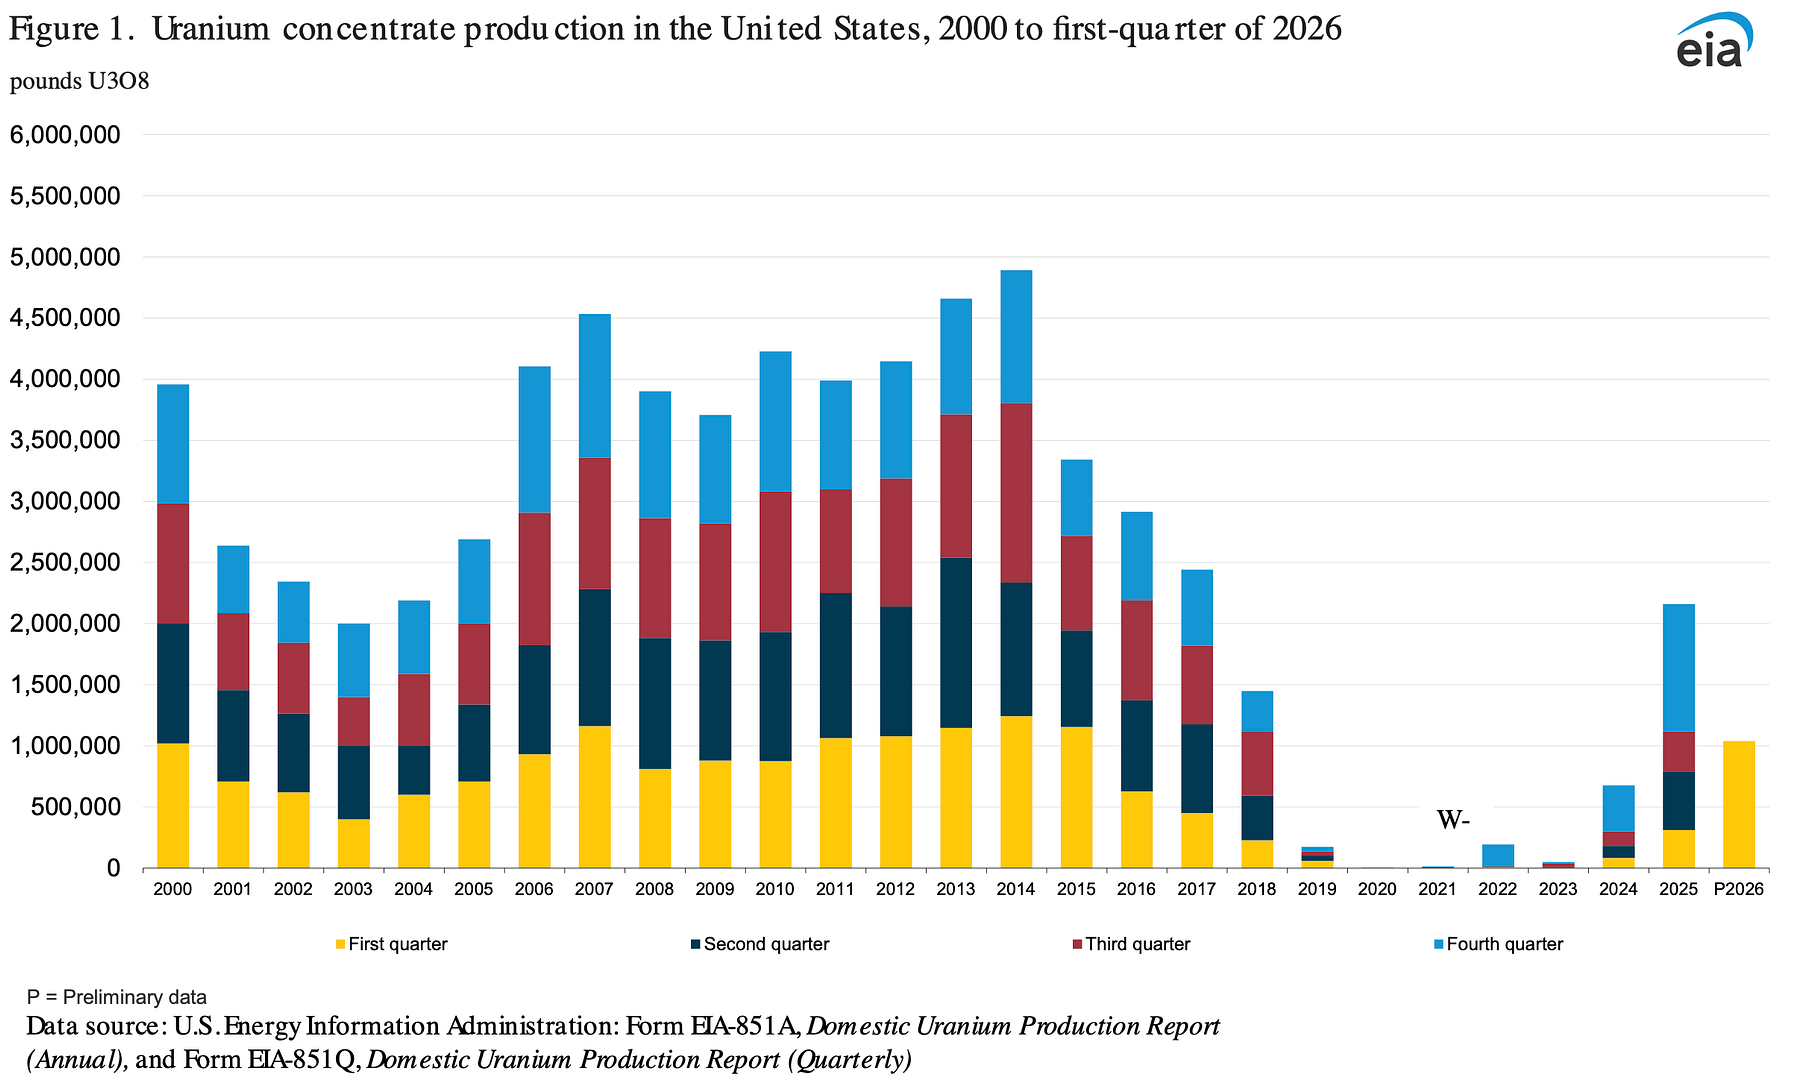
Uranium Production way up under Trump
Posted on 8/12/26 at 10:36 am
Posted on 8/12/26 at 10:36 am
Posted on 8/12/26 at 10:39 am to prplhze2000
*checks graph

quote:
way up under Trump
This post was edited on 8/12/26 at 10:40 am
Posted on 8/12/26 at 10:40 am to prplhze2000
What graph you looking at?
Posted on 8/12/26 at 10:41 am to prplhze2000
Unless I’m somehow misunderstanding the graph, it looks like it utterly collapse under Trump, started to go up under Biden, continued going up under Trump, but is now going back down under Trump.
You seeing something else?
This post was edited on 8/12/26 at 10:42 am
Posted on 8/12/26 at 10:41 am to prplhze2000
Looks like he dropped it almost to zero his first time in office.
Posted on 8/12/26 at 11:01 am to Joshjrn
quote:
You seeing something else?
The first quarter was the highest its been since 2015. 2nd quarter isn't on the chart yet.
Posted on 8/12/26 at 11:03 am to notsince98
quote:
The first quarter was the highest its been since 2015. 2nd quarter isn't on the chart yet.
Ok, fair enough. With that said, considering it collapsed under Trump, does it not seem a bit odd to note that it’s “way up” under Trump?

Posted on 8/12/26 at 11:04 am to hassan whiteside
Y’all don’t notice that only 1 quarter is accounted for on the latest bar?
Posted on 8/12/26 at 11:06 am to Joshjrn
quote:Kind of
Ok, fair enough. With that said, considering it collapsed under Trump, does it not seem a bit odd to note that it’s “way up” under Trump?
Is the context that Trump slowed it down, which is clearly visible on the grain, all that important?
Posted on 8/12/26 at 11:08 am to ReauxlTide222
quote:
Y’all don’t notice that only 1 quarter is accounted for on the latest bar?
Yeah, it is almost up to where it was the year prior to him starting his first term.
Posted on 8/12/26 at 11:16 am to Joshjrn
Was there some kind of policy change around 2014-2015? It was trending down before his first term, then continued throughout before bottoming out at the end, and wasn’t much at all under Biden either.
Posted on 8/12/26 at 11:20 am to MOT
Yo can take this shite to the politards
Posted on 8/12/26 at 11:32 am to LegendInMyMind
quote:You mean a decade ago?
Yeah, it is almost up to where it was the year prior to him starting his first term.
I don’t think y’all’s reactions are warranted simply because OP don’t mention Trump uranium policy a decade ago. It would have been better to add that it was also down in his first term, no doubt.
But then y’all went and read the graph wrong not noticing only 1/4 of this year is accounted for.
ETA: didn’t
This post was edited on 8/12/26 at 11:33 am
Posted on 8/12/26 at 11:36 am to ReauxlTide222
quote:
But then y’all went and read the graph wrong not noticing only 1/4 of this year is accounted for.
You're missing the fact that I compared the first quarter of this year to the first quarter the year prior to him taking office in 2016.
The OP provided no context beyond the graph. The graph shows uranium production dropping to nearly nothing under Donald 1.0. Without any other context, it looks like Donald is correcting a problem he created.
Posted on 8/12/26 at 11:37 am to CocomoLSU
The yellow part represents 1st quarter production.
Posted on 8/12/26 at 11:44 am to auggie
quote:
The yellow part represents 1st quarter production.
and the blue represents 4th qtr last year, so the last 2 qtrs have been highest in the last decade
Something must have gone on from 2014 to last year, no way to say what without more explanation
Posted on 8/12/26 at 12:54 pm to LegendInMyMind
quote:I think that’s the catalyst here. Did anyone say it was a problem?
Without any other context, it looks like Donald is correcting a problem he created.
I wasn’t operating under the assumption it was thought of as a problem.
OP, by providing little context, might have people thinking he’s saying it was a problem 7-10 years ago and Trump is fixing it now.
So yeah, I get that.
Posted on 8/12/26 at 1:02 pm to LegendInMyMind
quote:
Without any other context, it looks like Donald is correcting a problem he created.
In other words, WINNING BIGLY
Posted on 8/12/26 at 1:08 pm to ReauxlTide222
So, he tanked it to zero, to fix it and claim never before have we seen increases like this in American history. #Winning
Posted on 8/12/26 at 1:41 pm to Joshjrn
quote:
it looks like it utterly collapse under Trump
Looks like it in 2016
quote:
started to go up under Biden, continued going up under Trump
Yep
quote:
but is now going back down under Trump. You seeing something else?
It looks like it’s the highest Q1 on the graph. Wouldn’t that be going up?

 Page 1 of 2


Popular
Back to top
 Follow TigerDroppings for LSU Football News