




 2
2











- My Forums
- Tiger Rant
- LSU Recruiting
- SEC Rant
- Saints Talk
- Pelicans Talk
- More Sports Board
- Fantasy Sports
- Golf Board
- Soccer Board
- O-T Lounge
- Tech Board
- Home/Garden Board
- Outdoor Board
- Health/Fitness Board
- Movie/TV Board
- Book Board
- Music Board
- Political Talk
- Money Talk
- Fark Board
- Gaming Board
- Travel Board
- Food/Drink Board
- Ticket Exchange
- TD Help Board
Customize My Forums- View All Forums
- Show Left Links
- Topic Sort Options
- Trending Topics
- Recent Topics
- Active Topics
Started By
Message
re: Daily COVID Updated as of 11/2/20 8:00 PM
Posted on 3/25/20 at 12:58 am to NorCali
Posted on 3/25/20 at 12:58 am to NorCali
At the current growth rate of cases and deaths, if we have to wait 14 days to see an impact, then we will be up around 1-2M cases and around 25K dead.
Thats simply based on the current growth rates holding steady, who knows if they will.
Thats simply based on the current growth rates holding steady, who knows if they will.
Posted on 3/25/20 at 1:18 am to Chromdome35
quote:
25K dead
If this comes to fruition, we will have nuked the US economy to spare the city of Slidell (closest similar population). Whew...
Posted on 3/25/20 at 1:19 am to Chromdome35
quote:
At the current growth rate of cases and deaths, if we have to wait 14 days to see an impact, then we will be up around 1-2M cases and around 25K dead.
Thats simply based on the current growth rates holding steady, who knows if they will.
I think you'll start to see some significant regional and state variation here soon. I'd expect some places to start seeing plateaus in absolute numbers and significant drops in growth rates (at least in cases, if not deaths) starting early next week - maybe at the end of this week - while some other places will still be on an exponential curve up. The stand-in-shelter orders (or in Chicago's case, an approximation thereof) will be 14 - 17 days old by the end of this weekend in some of the first and hardest-hit areas of the country while some other areas still haven't even really considered it. It will be some noisy data.
This post was edited on 3/25/20 at 1:37 am
Posted on 3/25/20 at 1:34 am to Boring
It doesn't really seem worth it unless you're a citizen of Slidell...
Posted on 3/25/20 at 6:32 am to Chromdome35
So the weighted averages had a big jump from March 1st to March 6th.
That appears to correspond with the increase in deaths from March 14th to March 19th. Assuming an 18 day median time to death, that’s 5 days from onset of illness to a confirmed case.
It also indicates we should see a spike in deaths on March 27th to March 31st corresponding to the increase in cases from March 16th to March 20th.
That appears to correspond with the increase in deaths from March 14th to March 19th. Assuming an 18 day median time to death, that’s 5 days from onset of illness to a confirmed case.
It also indicates we should see a spike in deaths on March 27th to March 31st corresponding to the increase in cases from March 16th to March 20th.
Posted on 3/25/20 at 7:32 am to the808bass
Death numbers are going to look downright scary over the next 2~ weeks but hopefully we'll be on the down slope after that. Hopefully
Posted on 3/25/20 at 7:34 am to tiger91
quote:
But are these people going to stay on a vent forever if their conditions don’t improve enough to come off?
I don't know enough at this time to answer that and I don't think many people do. Most pulm specialists I know are treating this just like late-stage ARDS and using the same/similar decision tree
Posted on 3/25/20 at 7:55 am to Tiguar
quote:
Hopefully
Posted on 3/25/20 at 8:20 am to Boring
quote:
25K dead
quote:
If this comes to fruition, we will have nuked the US economy to spare the city of Slidell (closest similar population). Whew...
You need to work on your logic. Do you see where you went wrong?
Posted on 3/25/20 at 8:40 am to Chromdome35
This is the link to the COVID-19 tracker that I have shared on Google Drive. Chromdome's COVID-19 Daily Tracker
The source for the data is https://www.worldometers.info/coronavirus/
The source for the testing data is from https://covidtracking.com/data/
On the tracker sheet you will see tabs for the following data:
1) US Summary
2) Country Comparables: This shows you how the US stacks up vs. select other countries dealing with COVID-19
3) Italy Summary
4) UK Summary
5) France Summary
6) Germany Summary
If you would like a graph created that I don't have, just ask and if it's possible I will create it for you.
Due to space constraints on the PT board, I'm only posting a few graphs in the thread, if a consensus emerges of what graphs the PT wants to see in thread without having to go to the tracker, I will gladly change them up.
I am working to create a sheet that compares the US metrics to the other countries metrics. I'll let you all know when that's done and available.
NOTE: The daily growth rate data will not be accurate until the end of the day's postings. It will change throughout the day.
NOTE: I am not tracking individual states, I don't have a reliable consistent source for that data.
NOTE: I am not a mathematician, statistics guru, scientist, sharpest tack in the box, I'm just a guy who likes to understand for myself what is happening and to share it with others. This thread was not created to debate if you should or shouldn't take this seriously, it is simply to present the numbers and foster conversation.

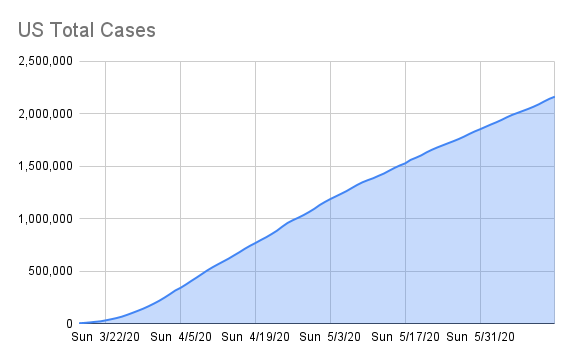



The source for the data is https://www.worldometers.info/coronavirus/
The source for the testing data is from https://covidtracking.com/data/
On the tracker sheet you will see tabs for the following data:
1) US Summary
2) Country Comparables: This shows you how the US stacks up vs. select other countries dealing with COVID-19
3) Italy Summary
4) UK Summary
5) France Summary
6) Germany Summary
If you would like a graph created that I don't have, just ask and if it's possible I will create it for you.
Due to space constraints on the PT board, I'm only posting a few graphs in the thread, if a consensus emerges of what graphs the PT wants to see in thread without having to go to the tracker, I will gladly change them up.
I am working to create a sheet that compares the US metrics to the other countries metrics. I'll let you all know when that's done and available.
NOTE: The daily growth rate data will not be accurate until the end of the day's postings. It will change throughout the day.
NOTE: I am not tracking individual states, I don't have a reliable consistent source for that data.
NOTE: I am not a mathematician, statistics guru, scientist, sharpest tack in the box, I'm just a guy who likes to understand for myself what is happening and to share it with others. This thread was not created to debate if you should or shouldn't take this seriously, it is simply to present the numbers and foster conversation.
Posted on 3/25/20 at 9:15 am to Chromdome35
Something odd happened with the numbers on world o meters last night. The usually restart the next day at 7 pm CDT (midnight GMT). At that time the numbers looked promising (~ 10000 cases and 135 fatalities) but a few hours later they dropped another 1500 cases and 100 fatalities for the “previous” day. I am wondering if they were only numbers from somewhere that had built up and got added for March 24. Interested to see what happens with today’s numbers.
Posted on 3/25/20 at 9:19 am to lsumatt
Yes, it's been noticed that previous days are updated. Hmmm
Posted on 3/25/20 at 9:24 am to Chromdome35
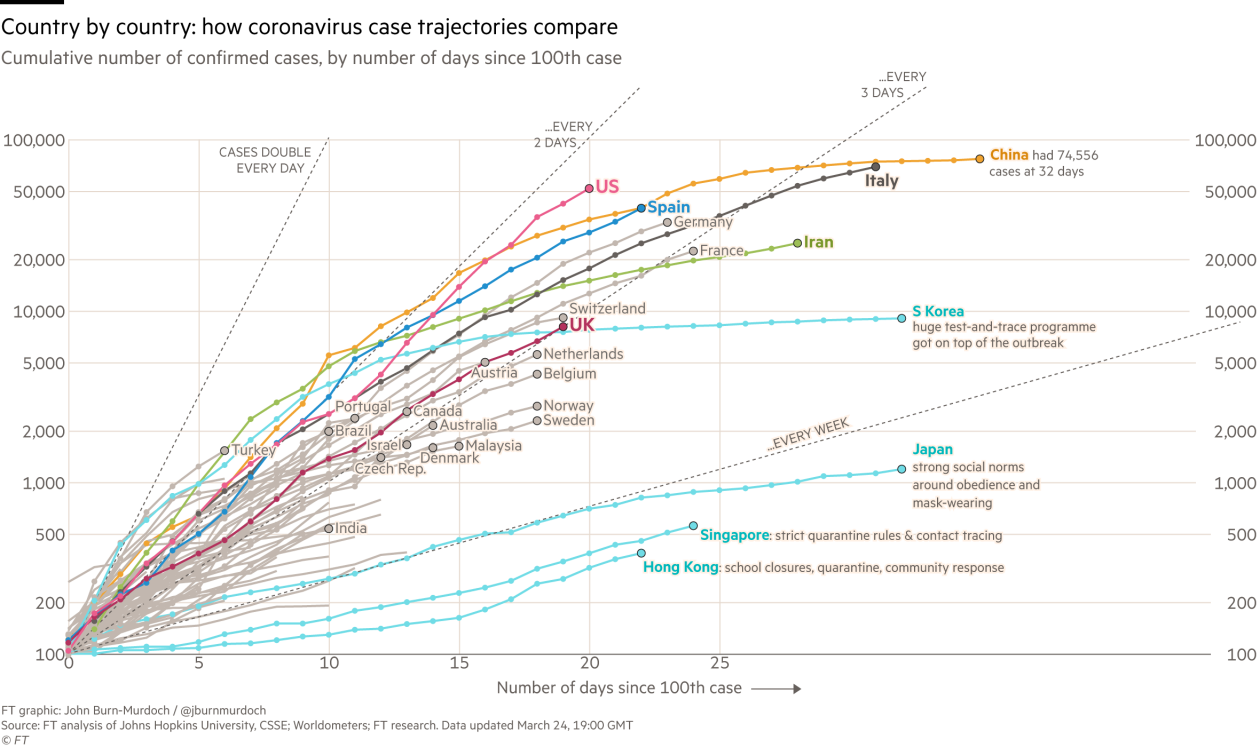
As of 3 PM yesterday we were about to pass China for most cases, but I've got some optimism about the slowing growth rate of cases over the last couple of days. Would feel more confident if we see it again today.
This post was edited on 3/25/20 at 9:25 am
Posted on 3/25/20 at 9:33 am to TigerDoc
What do you guys think are most inflections between 20 and 25 days?
Posted on 3/25/20 at 9:46 am to nerd guy
quote:Unfortunately testing is still catching up, so I would guess we hit 75K. Today is starting off very slow statistically.
What do you guys think are most inflections between 20 and 25 days?
Posted on 3/25/20 at 9:51 am to TigerDoc
It would be more useful if we could see everything by per capita instead of just baseline numbers.
Posted on 3/25/20 at 9:53 am to mmcgrath
quote:
Unfortunately testing is still catching up, so I would guess we hit 75K. Today is starting off very slow statistically.
True. That's probably a good guess. My thinking was we see number of positives slow down maybe late this week or early next week and deaths slow down in two weeks. Hopefully at least. Maybe top out around 100k positives.
This post was edited on 3/25/20 at 9:56 am
Posted on 3/25/20 at 9:57 am to Chicken
A lot of cities are lagging on testing and then dropping huge chunks of results once they are completed a day or two later.
Posted on 3/25/20 at 10:00 am to ConwayGamecock
quote:
It's a crying shame. Hopefully as you say, we'll learn something from this for the "next time". But really, this should have been the "next time", even if the first time was fabricated and only an exercise. We already knew......
When the DS got there data tat is when they knew to release the kracken (virus).
Posted on 3/25/20 at 10:02 am to cokebottleag
quote:
It would be more useful if we could see everything by per capita instead of just baseline numbers.
Per Capita is useful and understandable but I believe that population density is more reflective of the spread and infection rate. Contagion in Manhattan is a lot different than in the Sandhills of Nebraska or in the back country of Idaho.

 Page 68 of 331


Popular

Back to top
 Follow TigerDroppings for LSU Football News