- My Forums
- Tiger Rant
- LSU Recruiting
- SEC Rant
- Saints Talk
- Pelicans Talk
- More Sports Board
- Fantasy Sports
- Golf Board
- Soccer Board
- O-T Lounge
- Tech Board
- Home/Garden Board
- Outdoor Board
- Health/Fitness Board
- Movie/TV Board
- Book Board
- Music Board
- Political Talk
- Money Talk
- Fark Board
- Gaming Board
- Travel Board
- Food/Drink Board
- Ticket Exchange
- TD Help Board
Customize My Forums- View All Forums
- Show Left Links
- Topic Sort Options
- Trending Topics
- Recent Topics
- Active Topics
Started By
Message
Posted on 3/27/20 at 6:41 pm to Chromdome35
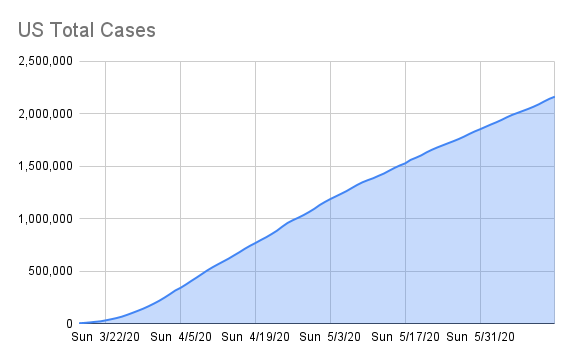
This is the link to the COVID-19 tracker that I have shared on Google Drive. Chromdome's COVID-19 Daily Tracker
The source for the data is https://www.worldometers.info/coronavirus/
The source for the testing data is from https://covidtracking.com/data/
On the tracker sheet you will see tabs for the following data:
1) US Summary
2) Country Comparables: This shows you how the US stacks up vs. select other countries dealing with COVID-19
3) Italy Summary
4) UK Summary
5) France Summary
6) Germany Summary
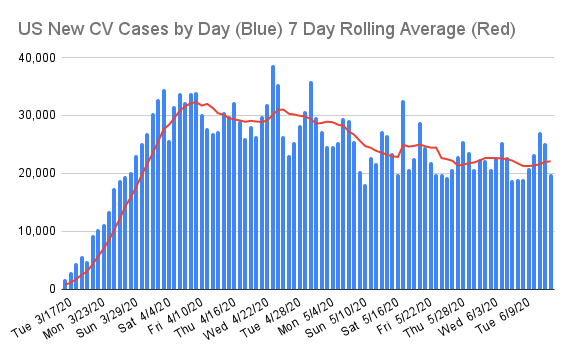
7) US Weighted Averages - Explores 7 day vs 3 day weight average trends
8) Predictive Model - A simple predictive model that shows where the numbers will be in the future if growth rates don't change
9) Logarithmic Comparisons - Shows the US vs the other countries on the tracker.
10) Sweden Summary
If you would like a graph created that I don't have, just ask and if it's possible I will create it for you.
Due to space constraints on the PT board, I'm only posting a few graphs in the thread, if a consensus emerges of what graphs the PT wants to see in thread without having to go to the tracker, I will gladly change them up.
I am working to create a sheet that compares the US metrics to the other countries metrics. I'll let you all know when that's done and available.
NOTE: The daily growth rate data will not be accurate until the end of the day's postings. It will change throughout the day.
NOTE: I am not tracking individual states, I don't have a reliable consistent source for that data.
NOTE: I am not a mathematician, statistics guru, scientist, sharpest tack in the box, I'm just a guy who likes to understand for myself what is happening and to share it with others. This thread was not created to debate if you should or shouldn't take this seriously, it is simply to present the numbers and foster conversation.

Posted on 3/27/20 at 6:42 pm to Chromdome35
Looks promising, will keep my fingers crossed until the 11 pm CST number dump.
Posted on 3/27/20 at 6:48 pm to Damone
Friday, Saturday, Sunday numbers seems to be of questionable value. I’d guess we will see a spike in Monday’s numbers.
Posted on 3/27/20 at 6:49 pm to the808bass
Truly sorry to hear this. How old is he?
Posted on 3/27/20 at 6:51 pm to tiger91
60s. His wife was hospitalized for a short time with the virus as well. She’s home recovering.
Posted on 3/27/20 at 6:55 pm to the808bass
I agree Bass, the weekend numbers seem to get a little screwy, interested to see if that is true this week.
Posted on 3/27/20 at 7:04 pm to Damone
quote:
Looks promising, will keep my fingers crossed until the 11 pm CST number dump.
I just started paying attention to this thread last night, but I think that this is about the time, of his last update on yesterdays numbers. After that, everything went on todays numbers.
I don't like the fact that there was a slight uptick in todays death percentage, and a more than slight decrease in todays new case percentage. Less new cases is great though, don't get me wrong. I was just hoping that todays deaths would be much less.
Posted on 3/27/20 at 8:29 pm to Chromdome35
1700 deaths. Over half of those came in the last 3 days.
Posted on 3/27/20 at 8:31 pm to Tiguar
How much of that is NY?
Or do we not have concrete info ?
Or do we not have concrete info ?
This post was edited on 3/27/20 at 8:31 pm
Posted on 3/27/20 at 8:33 pm to LosLobos111
Big uptick in last update. 400 fed today - High 18s in infections
Posted on 3/27/20 at 8:35 pm to Chromdome35
We just hit 400 deaths today.
Damn
Damn
Posted on 3/27/20 at 8:47 pm to Freight Joker
At what point do we start to genuinely fear this is turning into The Stand?
Posted on 3/27/20 at 8:49 pm to LosLobos111
NY is 606 of the 1695 deaths
The mortality rate in NY is 1.3%
The mortality rate in LA is 4.3%
The mortality rate in NY is 1.3%
The mortality rate in LA is 4.3%
This post was edited on 3/27/20 at 8:51 pm
Posted on 3/27/20 at 9:16 pm to TigerFanatic99
quote:
At what point do we start to genuinely fear this is turning into The Stand?
When I have less brain cells than my shoe size
Posted on 3/27/20 at 9:18 pm to Jrv2damac
Well, that’s not nearly as encouraging as you intended.
Posted on 3/27/20 at 9:19 pm to Chromdome35
This is the link to the COVID-19 tracker that I have shared on Google Drive. Chromdome's COVID-19 Daily Tracker
The source for the data is https://www.worldometers.info/coronavirus/
The source for the testing data is from https://covidtracking.com/data/
On the tracker sheet you will see tabs for the following data:
1) US Summary
2) Country Comparables: This shows you how the US stacks up vs. select other countries dealing with COVID-19
3) Italy Summary
4) UK Summary
5) France Summary
6) Germany Summary
7) US Weighted Averages - Explores 7 day vs 3 day weight average trends
8) Predictive Model - A simple predictive model that shows where the numbers will be in the future if growth rates don't change
9) Logarithmic Comparisons - Shows the US vs the other countries on the tracker.
10) Sweden Summary
If you would like a graph created that I don't have, just ask and if it's possible I will create it for you.
Due to space constraints on the PT board, I'm only posting a few graphs in the thread, if a consensus emerges of what graphs the PT wants to see in thread without having to go to the tracker, I will gladly change them up.
I am working to create a sheet that compares the US metrics to the other countries metrics. I'll let you all know when that's done and available.
NOTE: The daily growth rate data will not be accurate until the end of the day's postings. It will change throughout the day.
NOTE: I am not tracking individual states, I don't have a reliable consistent source for that data.
NOTE: I am not a mathematician, statistics guru, scientist, sharpest tack in the box, I'm just a guy who likes to understand for myself what is happening and to share it with others. This thread was not created to debate if you should or shouldn't take this seriously, it is simply to present the numbers and foster conversation.


The source for the data is https://www.worldometers.info/coronavirus/
The source for the testing data is from https://covidtracking.com/data/
On the tracker sheet you will see tabs for the following data:
1) US Summary
2) Country Comparables: This shows you how the US stacks up vs. select other countries dealing with COVID-19
3) Italy Summary
4) UK Summary
5) France Summary
6) Germany Summary
7) US Weighted Averages - Explores 7 day vs 3 day weight average trends
8) Predictive Model - A simple predictive model that shows where the numbers will be in the future if growth rates don't change
9) Logarithmic Comparisons - Shows the US vs the other countries on the tracker.
10) Sweden Summary
If you would like a graph created that I don't have, just ask and if it's possible I will create it for you.
Due to space constraints on the PT board, I'm only posting a few graphs in the thread, if a consensus emerges of what graphs the PT wants to see in thread without having to go to the tracker, I will gladly change them up.
I am working to create a sheet that compares the US metrics to the other countries metrics. I'll let you all know when that's done and available.
NOTE: The daily growth rate data will not be accurate until the end of the day's postings. It will change throughout the day.
NOTE: I am not tracking individual states, I don't have a reliable consistent source for that data.
NOTE: I am not a mathematician, statistics guru, scientist, sharpest tack in the box, I'm just a guy who likes to understand for myself what is happening and to share it with others. This thread was not created to debate if you should or shouldn't take this seriously, it is simply to present the numbers and foster conversation.

Posted on 3/27/20 at 9:38 pm to Chromdome35
Is there a gap on active/recovered cases because not everyone reports back "I feel fine"?
Posted on 3/27/20 at 9:50 pm to Bulldogblitz
“Recovered” takes two back to back negative tests which takes time and we probably aren’t keen on spending tests for that purpose right now
Popular
Back to top


 1
1


