- My Forums
- Tiger Rant
- LSU Recruiting
- SEC Rant
- Saints Talk
- Pelicans Talk
- More Sports Board
- Fantasy Sports
- Golf Board
- Soccer Board
- O-T Lounge
- Tech Board
- Home/Garden Board
- Outdoor Board
- Health/Fitness Board
- Movie/TV Board
- Book Board
- Music Board
- Political Talk
- Money Talk
- Fark Board
- Gaming Board
- Travel Board
- Food/Drink Board
- Ticket Exchange
- TD Help Board
Customize My Forums- View All Forums
- Show Left Links
- Topic Sort Options
- Trending Topics
- Recent Topics
- Active Topics
Started By
Message
 0
0

Posted on 3/28/20 at 12:13 am to Chromdome35
This is what we never had experienced this since the Spanish flu. All of us were caught off guard. This is a very good test for us to make the change and get ready for the next one that maybe the same or worst. This is what the World need to experience so we can learned from this one and make sure we are ready for the next one.
Posted on 3/28/20 at 1:09 am to RD Dawg
quote:
But they aren't.The rate of increased cases has declined the last 5 days.In others words, while increasing the aren't increasing exponentially.
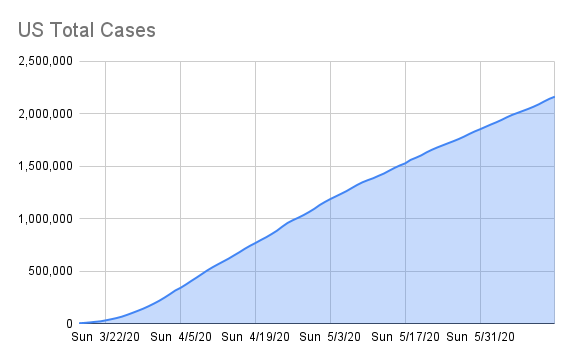
I look at it a bit differently by focusing on the absolute numbers. on March 22nd new cases were 9k, then 10k, then 11k, then 13k, then 17k, and now 18k today. So it doubled in 5 days. But look at the very first graph of total cases. The slope shows you how steep it is.
But I think I see the point you are trying to make. If you look at the 19th, it took 1 day to double, then on the 20th it took 3 days to double, and from there it took 5 days. So, I get it, the rate of day to day growth may have decelerated, but the absolute number of cases is still growing sharply and that is, unfortunately, the key metric since at this point the trend in deaths (and probably serious cases) is still aligned.

Posted on 3/28/20 at 1:11 am to NorCali
The real issue is that we have multiple outbreaks in large urban areas. So even while New York (hopefully) slows, Detroit and Chicago may be ramping up.
Posted on 3/28/20 at 1:23 am to Chromdome35
Perhaps a bit of good progress. A rapid test from Abbott was FDA cleared.
LINK
Next big diagnostic step will be a serology test to see who has been exposed and now immune to it. Conventional wisdom is about 50% of a population being exposed for good "herd" immunity.
LINK
Next big diagnostic step will be a serology test to see who has been exposed and now immune to it. Conventional wisdom is about 50% of a population being exposed for good "herd" immunity.
Posted on 3/28/20 at 6:55 am to NorCali
Worldwide numbers are now over 600,000.
Here is the timeline at how fast it is progressing.
Coronavirus timeline:
- January 19: 100 cases
- January 24: 1,000 cases
- February 12: 50,000 cases
- March 6: 100,000 cases
- March 18: 200,000 cases
- March 21: 300,000 cases
- March 24: 400,000 cases
- March 26: 500,000 cases
- March 28: 600,000 cases
At this rate we would be at a million cases by early next week.

Posted on 3/28/20 at 8:36 am to TiketheMiger
quote:
At this rate we would be at a million cases by early next week.
That's good. Would mean the death rate is well below 1% then.

Posted on 3/28/20 at 9:09 am to TeLeFaWx
quote:
That's good. Would mean the death rate is well below 1% then.
Why are you so confident deaths would not also increase at a similar rate?

Posted on 3/28/20 at 9:10 am to Tiguar
quote:
Why are you so confident deaths would not also increase at a similar rate?
I mean they clearly are. The charts in this thread only show U.S. deaths but the global deaths are climbing rapidly.

Posted on 3/28/20 at 9:19 am to Chromdome35
Labs don't run a full crew on weekend. And the crew that runs on the weekend is not as productive as the week day crews.
Posted on 3/28/20 at 9:25 am to jeffsdad
Have the final numbers from yesterday been posted?
Posted on 3/28/20 at 9:26 am to Chromdome35
This is the link to the COVID-19 tracker that I have shared on Google Drive. Chromdome's COVID-19 Daily Tracker
The source for the data is https://www.worldometers.info/coronavirus/
The source for the testing data is from https://covidtracking.com/data/
On the tracker sheet you will see tabs for the following data:
1) US Summary
2) Country Comparables: This shows you how the US stacks up vs. select other countries dealing with COVID-19
3) Italy Summary
4) UK Summary
5) France Summary
6) Germany Summary
7) US Weighted Averages - Explores 7 day vs 3 day weight average trends
8) Predictive Model - A simple predictive model that shows where the numbers will be in the future if growth rates don't change
9) Logarithmic Comparisons - Shows the US vs the other countries on the tracker.
10) Sweden Summary
If you would like a graph created that I don't have, just ask and if it's possible I will create it for you.
Due to space constraints on the PT board, I'm only posting a few graphs in the thread, if a consensus emerges of what graphs the PT wants to see in thread without having to go to the tracker, I will gladly change them up.
I am working to create a sheet that compares the US metrics to the other countries metrics. I'll let you all know when that's done and available.
NOTE: The daily growth rate data will not be accurate until the end of the day's postings. It will change throughout the day.
NOTE: I am not tracking individual states, I don't have a reliable consistent source for that data.
NOTE: I am not a mathematician, statistics guru, scientist, sharpest tack in the box, I'm just a guy who likes to understand for myself what is happening and to share it with others. This thread was not created to debate if you should or shouldn't take this seriously, it is simply to present the numbers and foster conversation.
Posted on 3/28/20 at 9:26 am to Janky
yes
Posted on 3/28/20 at 9:28 am to jeffsdad
We've seen some fluctuations in the results on weekends, given how this now has everyone's full attention, I suspect the labs will be staffed up over the weekend now.
Hopefully, this weekend's numbers will be more consistent.
Hopefully, this weekend's numbers will be more consistent.
Posted on 3/28/20 at 9:28 am to Chromdome35
Growth rate of new cases are continuing to fall. I believe they call that flattening.
Posted on 3/28/20 at 9:36 am to Janky
quote:
Growth rate of new cases are continuing to fall. I believe they call that flattening.
Yes. Looks like the measures are working.
Posted on 3/28/20 at 9:37 am to Janky
If we go through the weekend without a spike in rate, I’ll be very confident in our flattening. That will have been over 7 days which would be the longest without a spike since we’ve been doing this
Posted on 3/28/20 at 9:39 am to Tiguar
Praying
Posted on 3/28/20 at 9:42 am to the808bass
quote:It would be very high b/c you'd remove active cases. But it would also be a truer representation since active case mortality could go either way
What would it be right now?
Posted on 3/28/20 at 9:51 am to mostbesttigerfanever
quote:
But it would also be a truer representation since active case mortality could go either way
You can assume that pretty much 100% of the cases not considered critical will pull through and get discharged though.

 Page 88 of 331

Popular
Back to top