- My Forums
- Tiger Rant
- LSU Recruiting
- SEC Rant
- Saints Talk
- Pelicans Talk
- More Sports Board
- Fantasy Sports
- Golf Board
- Soccer Board
- O-T Lounge
- Tech Board
- Home/Garden Board
- Outdoor Board
- Health/Fitness Board
- Movie/TV Board
- Book Board
- Music Board
- Political Talk
- Money Talk
- Fark Board
- Gaming Board
- Travel Board
- Food/Drink Board
- Ticket Exchange
- TD Help Board
Customize My Forums- View All Forums
- Show Left Links
- Topic Sort Options
- Trending Topics
- Recent Topics
- Active Topics
Started By
Message
re: Daily COVID Updated as of 11/2/20 8:00 PM
Posted on 3/27/20 at 1:21 pm to make it rain
Posted on 3/27/20 at 1:21 pm to make it rain
quote:
Excuse my ignorance, but is there a chance we have already bent the curve? The difference between total cases reported and total active cases is only 4,000. I assume shortly we will begin to see a large number of the currently active cases begin to rapidly drop as the discharge rate increases due to simple letting the virus run its course.
I can see a large drop in active cases happen soon. My SIL got sick early last week & tested neg for flu. Got swabbed for COVID-19 & STILL has not seen results. So once her results are back & assuming positive, she'll be fully recovered (she already is). How many are in her situation? I'll bet hundreds to thousands.
 2
2


Posted on 3/27/20 at 1:38 pm to runforrestrun
quote:
So once her results are back & assuming positive, she'll be fully recovered (she already is).
That's not how it works. Assuming positive, she is now a clinical case. To be "recovered" she has to test negative, 2 tests, 24 hours apart.
That is part of the reason why the recoveries are really off - there is no motivation to test folks to clear for CDC's protocol, when there is a shortage of needed tests for clinical admissions.
But, obviously that is changing with the recent bump in recoveries - hell, recoveries are going to lag deaths in reporting for some time.

Posted on 3/27/20 at 2:00 pm to DougsMugs
It would have been if people didnt start dying.
Posted on 3/27/20 at 2:12 pm to Chromdome35
(no message)
This post was edited on 3/27/20 at 2:37 pm
Posted on 3/27/20 at 2:44 pm to Chromdome35
Damn, Italy at 909 deaths today.

Posted on 3/27/20 at 2:47 pm to bodask42
Worldometers is down.
Posted on 3/27/20 at 2:51 pm to TigerFanatic99
It has been going up and down for a couple of hours, probably getting hammered with traffic.
Posted on 3/27/20 at 2:57 pm to Chromdome35
quote:
probably getting hammered
There's a lot of that to go around.
Posted on 3/27/20 at 3:09 pm to runforrestrun
I have seen a lot of anecdotes about people in different states (other than NY) waiting on test results, especially from Quest Diagnostics. It seems like they got the test collecting up and running well before the labs were ready.
By the huge jumps in the rest of the states it appears that the private labs may be catching up with a backlog, which of course means that spotting trends will be difficult if not impossible.
By the huge jumps in the rest of the states it appears that the private labs may be catching up with a backlog, which of course means that spotting trends will be difficult if not impossible.
Posted on 3/27/20 at 3:14 pm to Ace Midnight
quote:quote:
probably getting hammered
There's a lot of that to go around.
No shite. I got hammered last night. Then about an hour my wife got hammered.
If ya know what I mean.

Posted on 3/27/20 at 3:15 pm to Ace Midnight
quote:
That is part of the reason why the recoveries are really off - there is no motivation to test folks to clear for CDC's protocol, when there is a shortage of needed tests for clinical admissions.
“Recoveries“ are probably closer to “treated and released by hospital and followed up with ID doc” at this point I’d guess.
Posted on 3/27/20 at 3:33 pm to Chromdome35
This is the link to the COVID-19 tracker that I have shared on Google Drive. Chromdome's COVID-19 Daily Tracker
The source for the data is https://www.worldometers.info/coronavirus/
The source for the testing data is from https://covidtracking.com/data/
On the tracker sheet you will see tabs for the following data:
1) US Summary
2) Country Comparables: This shows you how the US stacks up vs. select other countries dealing with COVID-19
3) Italy Summary
4) UK Summary
5) France Summary
6) Germany Summary
7) US Weighted Averages - Explores 7 day vs 3 day weight average trends
8) Predictive Model - A simple predictive model that shows where the numbers will be in the future if growth rates don't change
9) Logarithmic Comparisons - Shows the US vs the other countries on the tracker.
10) Sweden Summary
If you would like a graph created that I don't have, just ask and if it's possible I will create it for you.
Due to space constraints on the PT board, I'm only posting a few graphs in the thread, if a consensus emerges of what graphs the PT wants to see in thread without having to go to the tracker, I will gladly change them up.
I am working to create a sheet that compares the US metrics to the other countries metrics. I'll let you all know when that's done and available.
NOTE: The daily growth rate data will not be accurate until the end of the day's postings. It will change throughout the day.
NOTE: I am not tracking individual states, I don't have a reliable consistent source for that data.
NOTE: I am not a mathematician, statistics guru, scientist, sharpest tack in the box, I'm just a guy who likes to understand for myself what is happening and to share it with others. This thread was not created to debate if you should or shouldn't take this seriously, it is simply to present the numbers and foster conversation.
Posted on 3/27/20 at 3:34 pm to Chromdome35
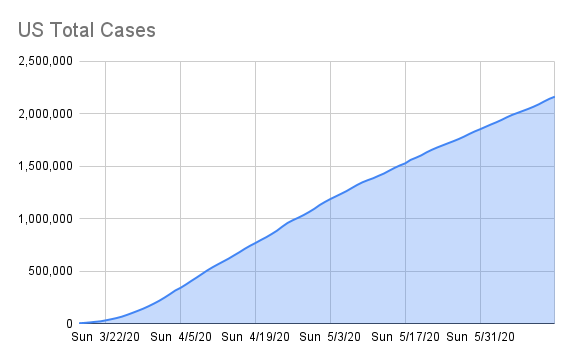
The US just passed the 100K cases milestone

Posted on 3/27/20 at 3:38 pm to Chromdome35
Could you post your predictive model? This is a great thread to follow. Thanks for keeping up with this
Posted on 3/27/20 at 3:43 pm to Powerman
Powerman,
You can find the model on the "Predictive Model as of 3/24/20" tab in my tracker which you can access here.
https://docs.google.com/spreadsheets/d/17R0Z5T063iqskP--0VXYtbnJqtkhU8RJ-5jL5_V1OZM/edit?pli=1#gid=864157221
Since the day isn't done, it could still get close on the number of cases predicted for today, I think it's going to be way under on deaths.
This post was edited on 3/27/20 at 3:45 pm

Posted on 3/27/20 at 3:45 pm to Chromdome35
The latest charts from FT including regions (now tracking Louisiana).


This post was edited on 3/27/20 at 3:57 pm

Posted on 3/27/20 at 3:47 pm to TigerDoc
Looks like the UK is following the US?
The UK is a bad country for this to happen to.
densely populated and lots of mass transit.
The UK is a bad country for this to happen to.
densely populated and lots of mass transit.
Posted on 3/27/20 at 3:48 pm to TigerDoc
You double posted one of those.
I love that site, I subscribed to it after you started posting stuff from it.
I love that site, I subscribed to it after you started posting stuff from it.
Posted on 3/27/20 at 3:53 pm to HailHailtoMichigan!
They're bending it a little better than us, but not much. I think they really flubbed things by waiting so long to move to suppression. Though the generation that can remember the blitz is mostly gone they've got a good history of community solidarity. The infosphere being what it is makes it difficult for folks to know what to trust, of course.
ETA: oops, Chrome. Fixed!
ETA2: Turkey's on track for disaster.
ETA: oops, Chrome. Fixed!
ETA2: Turkey's on track for disaster.
This post was edited on 3/27/20 at 3:58 pm
Posted on 3/27/20 at 3:57 pm to TigerDoc
New York (and Louisiana) are dragging down the U.S.' performance, bigly.
Those governors are underperforming (JBE, particularly).
Those governors are underperforming (JBE, particularly).

 Page 84 of 331

Popular
Back to top