- My Forums
- Tiger Rant
- LSU Recruiting
- SEC Rant
- Saints Talk
- Pelicans Talk
- More Sports Board
- Fantasy Sports
- Golf Board
- Soccer Board
- O-T Lounge
- Tech Board
- Home/Garden Board
- Outdoor Board
- Health/Fitness Board
- Movie/TV Board
- Book Board
- Music Board
- Political Talk
- Money Talk
- Fark Board
- Gaming Board
- Travel Board
- Food/Drink Board
- Ticket Exchange
- TD Help Board
Customize My Forums- View All Forums
- Show Left Links
- Topic Sort Options
- Trending Topics
- Recent Topics
- Active Topics
Started By
Message
re: Daily COVID Updated as of 11/2/20 8:00 PM
Posted on 3/27/20 at 11:14 am to Chromdome35
Posted on 3/27/20 at 11:14 am to Chromdome35
This is the link to the COVID-19 tracker that I have shared on Google Drive. Chromdome's COVID-19 Daily Tracker
The source for the data is https://www.worldometers.info/coronavirus/
The source for the testing data is from https://covidtracking.com/data/
On the tracker sheet you will see tabs for the following data:
1) US Summary
2) Country Comparables: This shows you how the US stacks up vs. select other countries dealing with COVID-19
3) Italy Summary
4) UK Summary
5) France Summary
6) Germany Summary
7) US Weighted Averages - Explores 7 day vs 3 day weight average trends
8) Predictive Model - A simple predictive model that shows where the numbers will be in the future if growth rates don't change
9) Logarithmic Comparisons - Shows the US vs the other countries on the tracker.
10) Sweden Summary
If you would like a graph created that I don't have, just ask and if it's possible I will create it for you.
Due to space constraints on the PT board, I'm only posting a few graphs in the thread, if a consensus emerges of what graphs the PT wants to see in thread without having to go to the tracker, I will gladly change them up.
I am working to create a sheet that compares the US metrics to the other countries metrics. I'll let you all know when that's done and available.
NOTE: The daily growth rate data will not be accurate until the end of the day's postings. It will change throughout the day.
NOTE: I am not tracking individual states, I don't have a reliable consistent source for that data.
NOTE: I am not a mathematician, statistics guru, scientist, sharpest tack in the box, I'm just a guy who likes to understand for myself what is happening and to share it with others. This thread was not created to debate if you should or shouldn't take this seriously, it is simply to present the numbers and foster conversation.
 2
2

Posted on 3/27/20 at 11:20 am to tiger91
quote:
For your example, isn’t it usual wt (250) - actual wt (270) / usual wt to determine %change??
well, it's a 20lbs weight gain in 1 day, no matter how you write it. The question is: What % of yesterday's weight, did you gain?
That's what I'm trying to keep up with, the percentage of change each day, from the previous day, so I can maybe see a trend.

Posted on 3/27/20 at 11:22 am to Chromdome35
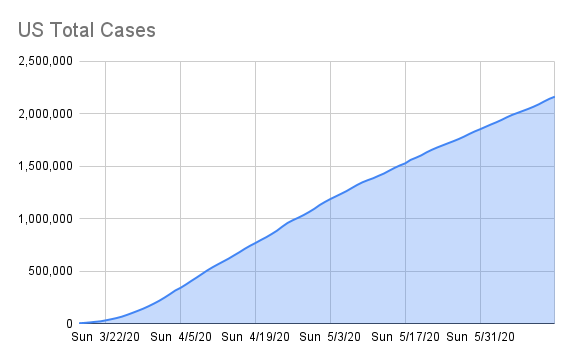
On the twentieth, we had about the same number of total cases as we had new cases yesterday.
Posted on 3/27/20 at 11:25 am to auggie
Augie, In my linked sheet, there is a tab called weighted averages. On there I show a 3 and 7 day weighted average of the growth rate in cases and deaths. The graphs show the declines you are talking about.
Cases

Deaths

Cases
Deaths

Posted on 3/27/20 at 11:26 am to the808bass
quote:
On the twentieth, we had about the same number of total cases as we had new cases yesterday.
1 week ago might as well be a year ago for this thing.
Especially as we've had Americans spreading this locally, probably since Christmas or shortly afterwards, flaring out significantly in February.

Posted on 3/27/20 at 11:32 am to Chromdome35
Can someone please explain how a person can possibly gain 20 lbs in a single day?
Thank you.
Posted on 3/27/20 at 11:32 am to Chromdome35
yeah, that shows it pretty well.
Posted on 3/27/20 at 11:33 am to Ace Midnight
Check this out, It was linked on Drudge.
This shows the movement of the cell phones from the spring breakers on one beach in Ft. Lauderdale after they left.
Very interesting
https://twitter.com/MikaelThalen/status/1243281598037913600
And another he posted of Manhattan Residents movements.
https://twitter.com/MikaelThalen/status/1243409301302960134
This post was edited on 3/27/20 at 11:36 am
Posted on 3/27/20 at 11:34 am to Nawlens Gator
quote:
Can someone please explain how a person can possibly gain 20 lbs in a single day? Thank you.
I guess you've never heard of Marcel Leadbetter?
Posted on 3/27/20 at 11:43 am to auggie
Augie, also check out the predictive model tab. It's a simple model, but it's doing fairly good at predicting the # of cases.
Yesterday it was 99.4% accurate on # cases and 94.6% accurate on deaths.
It says that at the end of today we should have 107K cases and 1,539 Deaths.
Yesterday it was 99.4% accurate on # cases and 94.6% accurate on deaths.
It says that at the end of today we should have 107K cases and 1,539 Deaths.
Posted on 3/27/20 at 11:58 am to Chromdome35
They are predicting only 244 deaths for today. That will be a serious drop from the 3 day average. That's great.

Posted on 3/27/20 at 12:04 pm to Chromdome35
That is pretty cool... wish he would do Mardi Gras weekend.
Posted on 3/27/20 at 12:08 pm to auggie
Yea...you are right. Like I said this model is simple. I have to adjust it every few days for the growth and mortality rates.
The Predicted deaths for the day are calculated by taking the predicted cases for the day (107K) and applying the Mortality rate of (1.43%) in the model, it's pretty basic.
The Predicted deaths for the day are calculated by taking the predicted cases for the day (107K) and applying the Mortality rate of (1.43%) in the model, it's pretty basic.
This post was edited on 3/27/20 at 12:13 pm
Posted on 3/27/20 at 12:22 pm to auggie
quote:
Marcel Leadbetter
lots of pieces of pie with the women.
Posted on 3/27/20 at 12:28 pm to Chromdome35
The daily death rate is way more unpredictable than the spread rate correct?
Posted on 3/27/20 at 12:35 pm to Groundscrew85
The death rate is based on the number of deaths / number of cases to date.
So far that works out to 1.48% to date. So if we have 100K deaths we should have 1,480 deaths, pretty simple math.
Now we know the number of cases is WAY undercounted at the moment, so the actual mortality rate is lower than the 1.48%, but until this is over and they have time to breakdown all the data (some of which they don't even have yet) we won't really know what the true mortality rate of COVID-19 is. So until that time we just have the current mortality rate to go off of.
Posted on 3/27/20 at 12:54 pm to Chromdome35
Excuse my ignorance, but is there a chance we have already bent the curve? The difference between total cases reported and total active cases is only 4,000. I assume shortly we will begin to see a large number of the currently active cases begin to rapidly drop as the discharge rate increases due to simple letting the virus run its course.
In other words, if we continue at a 20,000/30,000 per day in new cases, but start to experience a 5,000/10,000 per day drop in active cases as people are discharged, won't the curve begin to bend? In other words, the curve cant bend until the incubation period runs its course on the first round of those diagnosed.
In other words, if we continue at a 20,000/30,000 per day in new cases, but start to experience a 5,000/10,000 per day drop in active cases as people are discharged, won't the curve begin to bend? In other words, the curve cant bend until the incubation period runs its course on the first round of those diagnosed.
This post was edited on 3/27/20 at 12:57 pm
Posted on 3/27/20 at 1:12 pm to Chromdome35
Looks like the curve is starting to bend.

Posted on 3/27/20 at 1:19 pm to Chromdome35
quote:
So if we have 100K cases we should have 1,480 deaths, pretty simple math.
But, I knew what you meant.
Posted on 3/27/20 at 1:20 pm to Chromdome35
I thought the mortality rate would be below 1 by the middle of this last week. :-(

 Page 83 of 331

Popular
Back to top