- My Forums
- Tiger Rant
- LSU Recruiting
- SEC Rant
- Saints Talk
- Pelicans Talk
- More Sports Board
- Fantasy Sports
- Golf Board
- Soccer Board
- O-T Lounge
- Tech Board
- Home/Garden Board
- Outdoor Board
- Health/Fitness Board
- Movie/TV Board
- Book Board
- Music Board
- Political Talk
- Money Talk
- Fark Board
- Gaming Board
- Travel Board
- Food/Drink Board
- Ticket Exchange
- TD Help Board
Customize My Forums- View All Forums
- Show Left Links
- Topic Sort Options
- Trending Topics
- Recent Topics
- Active Topics
Started By
Message

Why would Maricopa County have a Republican voter heat map on the wall?
Posted on 12/14/22 at 8:26 pm
Posted on 12/14/22 at 8:26 pm
Why would a place that is just collecting votes, have a need to identify heavy Republican precincts and place it on the wall?
UncoverDC
UncoverDC
quote:
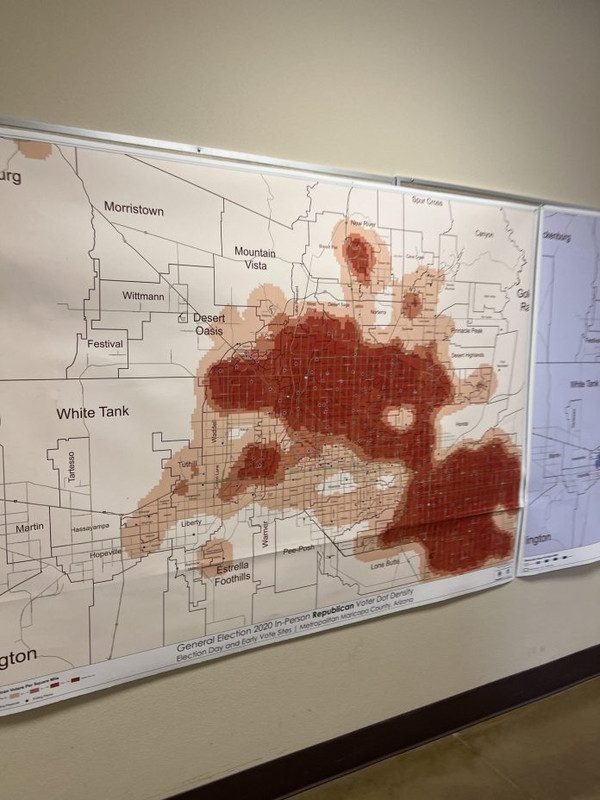
Richard “The People’s Pundit” Baris recently shared an interesting picture during his podcast—Inside The Numbers (Episode 307)—and in his Locals.com community. The photograph was one he took while inside the Maricopa County Tabulation and Election Center (MCTEC) soon after the recent Arizona midterm election. It showed a “Heat Map” reportedly hung on the wall inside the vote counting center titled:
General Election 2020 In-Person Republican Vote Dot Density
Election Day and Early Vote Sites | Metropolitan Maricopa, Arizona
quote:
That presumably means Maricopa election officials readily had access to the heat map while preparing and certifying the election equipment—before sending the units out to the various voting locations.
It becomes even more problematic when you consider where the problems with the Ballot on Demand printers and tabulators actually occurred.
quote:
Baris compared the information displayed on the map to the results of polling he did on behalf of the Kari Lake campaign and the Arizona GOP (AZGOP). The first of the two large, deep red “blobs” in the northern part of Maricopa County encompasses parts of the newly created AZ-1 Congressional District. It was believed to be a fairly “safe” Republican district before the election, but was barely won by David Schweikert (R) by about 3,200 votes out of over 361K cast according to Decision Desk HQ—much closer than expected. According to Baris’ post-election polling, 30% of all voters who experienced election day problems with voting equipment in Maricopa were within this area on the heat map.
 12
12

Posted on 12/14/22 at 8:27 pm to burger bearcat
Mickey will explain it all for us soon.
Posted on 12/14/22 at 8:46 pm to burger bearcat
quote:
Why would Maricopa County have a Republican voter heat map on the wall?
Honest question - what does it matter?
Posted on 12/14/22 at 8:54 pm to David_DJS
quote:
Honest question - what does it matter?
I'm not sure your question? You don't find it odd they have a map (that would have been very expensive and time consuming to have made), displaying Republican centered area, on the wall of the place that sends out equipment and counts votes.
Is it supposed to be a coincidence that all the Republican precincts were the ones having issues on election day?

Posted on 12/14/22 at 8:57 pm to burger bearcat
(D)ifferent
Posted on 12/14/22 at 8:58 pm to burger bearcat
It’s obvious the map next to it is the Democratic version so not seeing how this is some big “gotcha” moment
Posted on 12/14/22 at 9:06 pm to burger bearcat
quote:
I'm not sure your question? You don't find it odd they have a map (that would have been very expensive and time consuming to have made), displaying Republican centered area, on the wall of the place that sends out equipment and counts votes
I don't find it odd. But let's say it's odd, how is it nefarious? Do you think it's uncommon knowledge where Maricopa county is more conservative -v- where it's more liberal?
quote:
Is it supposed to be a coincidence that all the Republican precincts were the ones having issues on election day?
So no voting centers in Phoenix had issues? I don't think this is true.

Posted on 12/14/22 at 9:07 pm to burger bearcat
There’s a democrat one right next to it, fwiw

Posted on 12/14/22 at 9:07 pm to David_DJS
you know why
Posted on 12/14/22 at 9:08 pm to lsunurse
quote:
It’s obvious the map next to it is the Democratic version so not seeing how this is some big “gotcha” moment
This was already confirmed not a Democrat map. It was a map of drop box locations.
But even if it was. Why would a voting center have any interest in this whatsoever? There job is to be fair, neutral, and imbalanced. How would heat maps (that parties typically would have) be of any relevance to election workers at the voting centers?
Posted on 12/14/22 at 9:09 pm to ReauxlTide222
quote:
There’s a democrat one right next to it, fwiw
Nope. This was a a drop box map
Posted on 12/14/22 at 9:10 pm to burger bearcat
Oh
How do you know?
How do you know?

Posted on 12/14/22 at 9:12 pm to burger bearcat
It is odd, it is quite suspect. And it’s a worthwhile question, one that will never be answered, because it was a reference for those on the dark side.
This post was edited on 12/14/22 at 9:16 pm
Posted on 12/14/22 at 9:13 pm to burger bearcat
quote:
Nope. This was a a drop box map
Proof?
Posted on 12/14/22 at 9:15 pm to lsunurse
quote:
It’s obvious the map next to it is the Democratic version
Do you have an image showing them, because it isn’t “obvious” at all.
Posted on 12/14/22 at 9:16 pm to burger bearcat
quote:
This was a a drop box map
Because it was in blue?

Posted on 12/14/22 at 9:17 pm to burger bearcat
quote:
Nope. This was a a drop box map
Took me 2 seconds to google this.
https://apnews.com/article/fact-check-maricopa-county-map-447390498107
quote:
CLAIM: Election officials in Arizona’s Maricopa County displayed a map of Republican voters in the county at its central tabulation facility in Phoenix, but did not have a comparable Democrat voter map.
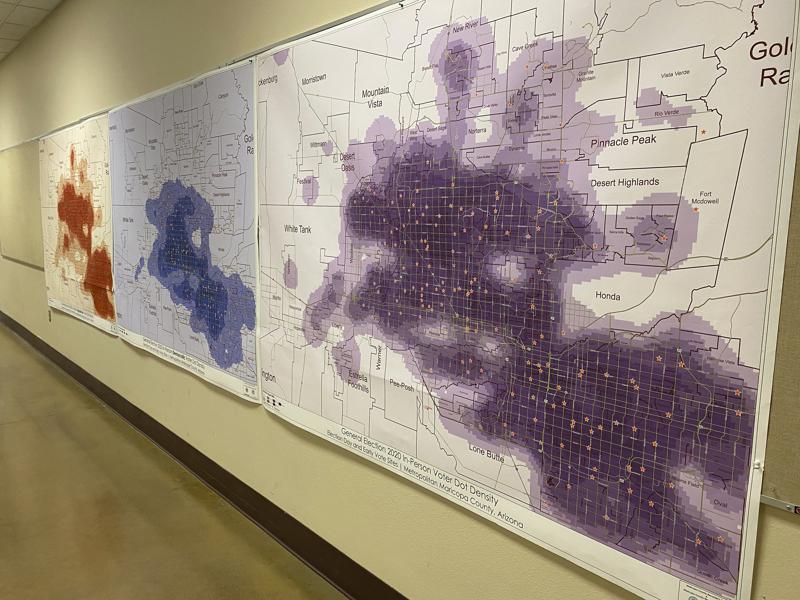
AP’S ASSESSMENT: False. Heat maps showing past Republican and Democrat voter turnout are both displayed in the Maricopa County Elections Department’s central tabulation facility, according to a spokesperson for the department and a photograph she provided to The Associated Press.
THE FACTS: A photograph of a heat map showing Republican voters in Maricopa County displayed at the tabulation center spread widely on blogs and social media Monday, with many users claiming that no equivalent Democrat voter map was displayed. Heat maps use data-visualization to examine information.
“Maricopa’s Heat Map of GOP voters. No Heat Map of Independents. No Heat Map of Democrats. Just Republicans,” Mark Finchem, a Republican who lost his bid for Arizona secretary of state in the midterm election, wrote on Twitter Monday. The tweet was shared over 1,000 times.
A Monday blog post similarly asserted that Maricopa County displayed a heat map of “expected” GOP voters and that the elections department “did not have a similar Democrat heat map hanging on their wall.”
But that’s not correct. Maricopa County elections officials displayed heat maps showing both past Republican and Democrat voter turnout, Megan Gilbertson, a spokesperson for the Maricopa County Elections Department, wrote in an email to the AP.
The maps, which are displayed in a hallway at the county’s central tabulation facility in downtown Phoenix, show in-person voter turnout in the 2020 general election, Gilbertson wrote.
A photo taken Monday that Gilbertson provided to the AP shows three maps in the hallway at the facility: a Republican in-person voter turnout map, a Democrat in-person voter map, and a total in-person voter turnout version. The blue Democratic map is right next to the red Republican one; the corner of the blue map is visible in the photograph shared by those promoting the false claim.
The maps are used to make “data-driven decisions on the best places to have voting locations in future elections,” she explained.
“The Maricopa County Recorder’s Office has a Geographic Information System (GIS) team that makes all of the maps in-house,” Gilbertson added. “We use the turnout data by party for elections such as the Presidential Preference Election, which is a party-only election. We use the all-voter maps for future planning for Primary and General elections.”
The maps were made in late 2020 and were hung in the facility hallway in January 2021, according to Gilbertson. Similar in-person turnout maps were made in 2019 during planning for the 2020 presidential preference election.
One of the blogs that shared the false claim about the county only having a Republican map has since published an additional post acknowledging that a Democrat map was also installed.
Finchem did not respond to the AP’s request for comment.
Posted on 12/14/22 at 9:18 pm to roadGator
quote:
Mickey will explain it all for us soon.
Someone has to
Posted on 12/14/22 at 9:19 pm to jimmy the leg

Posted on 12/14/22 at 9:27 pm to burger bearcat
quote:
Why would Maricopa County have a Republican voter heat map on the wall?
You guys need to stop falling for the bullshite. It doesn't help our side at all. I'm convinced there are Leftists out there posting shite like this (and the 60% of voting centers were shut down, and the graph that shows "in the 2018 election for governor the Republican winner got half the votes KL got in a loss") to gaslight the Right, and we f'n fall for it every time.

 Page 1 of 10

Popular
Back to top