




 2
2





- My Forums
- Tiger Rant
- LSU Recruiting
- SEC Rant
- Saints Talk
- Pelicans Talk
- More Sports Board
- Fantasy Sports
- Golf Board
- Soccer Board
- O-T Lounge
- Tech Board
- Home/Garden Board
- Outdoor Board
- Health/Fitness Board
- Movie/TV Board
- Book Board
- Music Board
- Political Talk
- Money Talk
- Fark Board
- Gaming Board
- Travel Board
- Food/Drink Board
- Ticket Exchange
- TD Help Board
Customize My Forums- View All Forums
- Show Left Links
- Topic Sort Options
- Trending Topics
- Recent Topics
- Active Topics
Started By
Message
re: Daily COVID Updated as of 11/2/20 8:00 PM
Posted on 3/30/20 at 7:53 am to Mahootney
Posted on 3/30/20 at 7:53 am to Mahootney
quote:
Which side of the fence is this guy on?
Seems to me like he is on the MSM side.
Noone under 40 has yet to kick the bucket without pre-existing conditions, yet he is calling for 4 more months of compelte shutdown... despite the fact that it still won't prevent the spread to every human in the USA.
Dr. Birx just stated on the Today Show that Best-Case scenario - "if we do things almost perfectly" - we could see up to 200,000 deaths from this.
Not cases. Deaths. Anyone want to tell us how many flu deaths there are again?
Posted on 3/30/20 at 7:54 am to uppermidwestbama
Trump said yesterday that we're likely to hit our peak daily deaths in about 2 weeks.
If that's true, we're likely hitting our peak daily new cases now, or in the next couple of days, given the lag between positive results and deaths.
Is this chart trying to peak?

If that's true, we're likely hitting our peak daily new cases now, or in the next couple of days, given the lag between positive results and deaths.
Is this chart trying to peak?
Posted on 3/30/20 at 7:56 am to RidiculousHype
quote:
Trump said yesterday that we're likely to hit our peak daily deaths in about 2 weeks.
If that's true, we're likely hitting our peak daily new cases now, or in the next couple of days, given the lag between positive results and deaths.
Solid point!
Posted on 3/30/20 at 8:09 am to RidiculousHype
quote:
Is this chart trying to peak?
The daily cases chart will always have a lot of noise in it. The better one to look at is the logarithmic total cases chart(not sure how to link from Google Sheets), and look for the slope to start decreasing.
It's obvious in the Italy one. It's not so obvious in ours. If we are 11 days behind Italy though, you should start to see it by tomorrow.
Posted on 3/30/20 at 8:18 am to ConwayGamecock
quote:
Anyone want to tell us how many flu deaths there are again?
During a bad flu season it can approach 80k deaths. 200k would be, obviously, 2 1/2x that. 160k would be 2x that. 100k would 1 1/4x that.
Yes, multiples of a very bad flu season, but not orders of magnitude.
Keep in mind that (likely flawed, alarmist even) early models had this well into the 7 figure range. Extreme actions were taken to attempt to save potentially millions of Americans.
However much I think this was all an overreaction, I simply did not have access to the data that national policy makers did. If this thing settles into a 60k or 70k final death tally, folks will likely still believe it was an "overreaction".
We'll likely never know now, but with Italy and now Spain with terrible results, other nations with a more moderate impact, most reasonable folks will likely conclude that it was better to be safe than sorry with this one.
Ultimately China bears the responsibility for their non-transparency.
Posted on 3/30/20 at 8:23 am to Ace Midnight
quote:
Ultimately China bears the responsibility for their non-transparency.
This is the fact that all sides of the American discussion HAVE to acknowledge. It needs to be the starting point. I’ve got plenty of criticisms of Trump but if people don’t recognize the evil level of shite China committed they aren’t arguing in good faith.
Posted on 3/30/20 at 8:46 am to ConwayGamecock
Maybe 200,000 deaths worldwide. In that case, there’s an average of 650,000 worldwide flu deaths.
Posted on 3/30/20 at 8:48 am to Chromdome35
And we're off...
This is the link to the COVID-19 tracker that I have shared on Google Drive. Chromdome's COVID-19 Daily Tracker
The source for the data is https://www.worldometers.info/coronavirus/
The source for the testing data is from https://covidtracking.com/data/
On the tracker sheet you will see tabs for the following data:
1) US Summary
2) Country Comparables: This shows you how the US stacks up vs. select other countries dealing with COVID-19
3) Logarithmic Comparisons - Shows the US vs the other countries on the tracker.
4) Covid Vs Other Outbreaks - Compares the current COVID numbers to the last 10 years of flue and H1N1
5) US Weighted Averages - Explores 7 day vs 3 day weight average trends
6) Italy Summary
7) UK Summary
8) France Summary
9) Germany Summary
10) Sweden Summary
11) World Summary
NOTE: The daily growth rate data will not be accurate until the end of the day's postings. It will change throughout the day.
NOTE: I am not tracking individual states, I don't have a reliable consistent source for that data.
NOTE: I am not a mathematician, statistics guru, scientist, sharpest tack in the box, I'm just a guy who likes to understand for myself what is happening and to share it with others. This thread was not created to debate if you should or shouldn't take this seriously, it is simply to present the numbers and foster conversation.
I changed the formating of the numbers in the table to reflect positive movements (Green) vs negative movements (Red). This will allow you to quickly see how the numbers are moving.

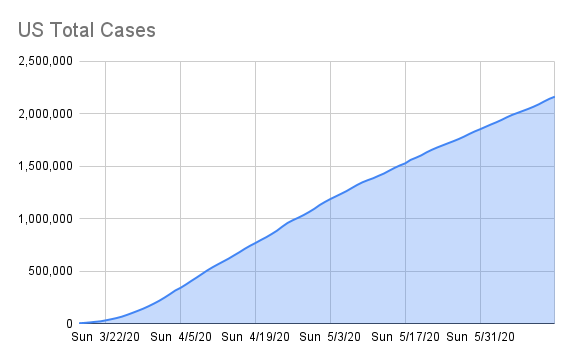


This is the link to the COVID-19 tracker that I have shared on Google Drive. Chromdome's COVID-19 Daily Tracker
The source for the data is https://www.worldometers.info/coronavirus/
The source for the testing data is from https://covidtracking.com/data/
On the tracker sheet you will see tabs for the following data:
1) US Summary
2) Country Comparables: This shows you how the US stacks up vs. select other countries dealing with COVID-19
3) Logarithmic Comparisons - Shows the US vs the other countries on the tracker.
4) Covid Vs Other Outbreaks - Compares the current COVID numbers to the last 10 years of flue and H1N1
5) US Weighted Averages - Explores 7 day vs 3 day weight average trends
6) Italy Summary
7) UK Summary
8) France Summary
9) Germany Summary
10) Sweden Summary
11) World Summary
NOTE: The daily growth rate data will not be accurate until the end of the day's postings. It will change throughout the day.
NOTE: I am not tracking individual states, I don't have a reliable consistent source for that data.
NOTE: I am not a mathematician, statistics guru, scientist, sharpest tack in the box, I'm just a guy who likes to understand for myself what is happening and to share it with others. This thread was not created to debate if you should or shouldn't take this seriously, it is simply to present the numbers and foster conversation.
I changed the formating of the numbers in the table to reflect positive movements (Green) vs negative movements (Red). This will allow you to quickly see how the numbers are moving.
Posted on 3/30/20 at 8:53 am to Chromdome35
Praying for a good day.
(Can you explain those milestones?
Is that when you estimated we get to 1000 deaths per day? And when it's expected to meet the H1N1 deaths?)
(Can you explain those milestones?
Is that when you estimated we get to 1000 deaths per day? And when it's expected to meet the H1N1 deaths?)
This post was edited on 3/30/20 at 9:00 am
Posted on 3/30/20 at 8:56 am to tiger91
quote:
Praying for a good day. Can you explain those milestones?
Is that when you estimated we get to 1000 deaths per day? And when it's expected to meet the H1N1 deaths?
Good idea, last Sunday's national day of prayer really helped.
Posted on 3/30/20 at 9:04 am to TopFlightSecurity
I’m smiling for the first time in 30 days .
Please please please let not these numbers be a fluke .
Please please please let not these numbers be a fluke .
Posted on 3/30/20 at 9:05 am to Ace Midnight
quote:
If this thing settles into a 60k or 70k final death tally, folks will likely still believe it was an "overreaction".
It's odd because a 60k or 70k death tally even with our measures suggests something a lot worse if we did nothing.
Posted on 3/30/20 at 9:09 am to Tiguar
Anyone else think the numbers from yesterday are odd. Only a 12% growth in deaths as opposed to a 30% on Saturday. I wonder if today will go the other due to some rollover from yesterday's numbers.
Posted on 3/30/20 at 9:12 am to Janky
Cases statistically have to go up or deaths have to go down. We are at a 1.7~% mortality rate which is a good bit higher than the anticipated rate.
If cases dont go up but deaths do, we arent testing well.
If cases dont go up but deaths do, we arent testing well.
Posted on 3/30/20 at 9:12 am to Tiguar
quote:No, it doesn't.
even with our measures suggests something a lot worse if we did nothing.
The whole point of our social distancing is NOT to prevent deaths.
It's intended to stretch out how long the infections, and deaths, keep happening so as not to overwhelm our medical system all at once.
Dr. Fauci has repeatedly said everyone who doesn't have an immunity to the virus will eventually get it. It's just a matter of when.
Posted on 3/30/20 at 9:14 am to tiger91
Tiger, yes. Those are based on my very simple prediction model. It may not get the exact day correct, but it will be pretty close.
Posted on 3/30/20 at 9:15 am to Janky
Janky, The numbers yesterday were abnormally low compared to the trending. Is that because it was Sunday and reporting was delayed or is it a true decline, We'll find out today.
Posted on 3/30/20 at 9:27 am to Tiguar
quote:
If cases dont go up but deaths do, we arent testing well.
But won't deaths continue to go up for a while once new cases plateau? The deaths are "behind" in that respect are they not?
Posted on 3/30/20 at 9:30 am to Tiguar
quote:
We are at a 1.7~% mortality rate which is a good bit higher than the anticipated rate.
Eh. If we’re capturing 50% of cases, that puts the CFR well under 1%. We’re not doing blanket testing and that would be of limited value without also testing for antibodies.
Posted on 3/30/20 at 9:48 am to Chromdome35
quote:
Janky, The numbers yesterday were abnormally low compared to the trending. Is that because it was Sunday and reporting was delayed or is it a true decline, We'll find out today.
Will be interesting to see. As I've noted previously, I think the most telling statistic to date is mortality rates per capita due to the wildly varying testing regimes from country to country. And the US and Germany continue to trend closely together in that respect as they have the past week plus (currently ranked 22 and 23, respectively, at 8 and 7 deaths per million).
What's astonishing to me is the media's take on both of these. Germany is largely praised as the paragon of COVID response, largely due to their testing volume. But their citizens are dying at the same clip as the US, whose response is considered a colossal failure by the same people.

 Page 98 of 331



Popular

Back to top
 Follow TigerDroppings for LSU Football News