- My Forums
- Tiger Rant
- LSU Recruiting
- SEC Rant
- Saints Talk
- Pelicans Talk
- More Sports Board
- Fantasy Sports
- Golf Board
- Soccer Board
- O-T Lounge
- Tech Board
- Home/Garden Board
- Outdoor Board
- Health/Fitness Board
- Movie/TV Board
- Book Board
- Music Board
- Political Talk
- Money Talk
- Fark Board
- Gaming Board
- Travel Board
- Food/Drink Board
- Ticket Exchange
- TD Help Board
Customize My Forums- View All Forums
- Show Left Links
- Topic Sort Options
- Trending Topics
- Recent Topics
- Active Topics
Started By
Message
re: Daily COVID Updated as of 11/2/20 8:00 PM
Posted on 8/31/20 at 4:40 pm to Volsfan82169
Posted on 8/31/20 at 4:40 pm to Volsfan82169
It's over in FL LINK
 1
1

Posted on 8/31/20 at 5:36 pm to Tallyman
Nationwide positivity dropped below 5% today, to 4.6%. Just need the stupid death number to drop. We're going to get the sub 1k death day on a normal reporting day sometime this week, as long as Texas doesn't dump all over us.
Posted on 8/31/20 at 6:10 pm to Chromdome35
This is the link to the COVID-19 tracker that I have created and shared on Google Drive.
If you want to view the shared sheet, follow this link COVID-19 Tracker
If you want to download a copy of this sheet and manipulate it follow this link Downloadable COVID-19 Tracker
The source for the data is from https://covidtracking.com/data/


New Cases by State

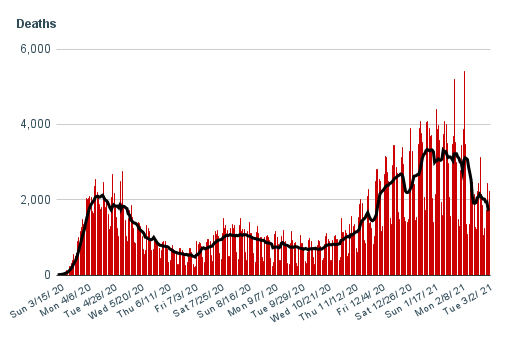
New Deaths by State

7-day average growth rate of new cases

If you want to view the shared sheet, follow this link COVID-19 Tracker
If you want to download a copy of this sheet and manipulate it follow this link Downloadable COVID-19 Tracker
The source for the data is from https://covidtracking.com/data/
New Cases by State
New Deaths by State
7-day average growth rate of new cases
Posted on 8/31/20 at 6:14 pm to Chromdome35
Chrome, can you do a 7-day average growth rate heat map for deaths too? I think those are more valuable than the absolute maps. Those just get slanted due to the high population states, while the case growth map shows that the Sun Belt case surge may have moved north with the weather.
Posted on 8/31/20 at 6:15 pm to AUMIS01
quote:
Nationwide positivity dropped below 5% today, to 4.6%. Just need the stupid death number to drop. We're going to get the sub 1k death day on a normal reporting day sometime this week, as long as Texas doesn't dump all over us.
I am concerned that the latest round of protests and getting in faces of Trump supporters will cause a case spike in two weeks. I hope I am wrong.
Also, college kids back at school will cause a spike, but will also drive down the death rate.
Posted on 8/31/20 at 6:19 pm to Athanatos
How about basing it on per capita instead of 7day avg growth rate?
This is a heatmap of 7-day Avg Growth in Cases
This is a heatmap of 7-day Avg Growth in Deaths

This is a heatmap of per capita new cases by state

This is a heatmap of per capita new deaths by state

This is a heatmap of 7-day Avg Growth in Cases
This is a heatmap of 7-day Avg Growth in Deaths
This is a heatmap of per capita new cases by state
This is a heatmap of per capita new deaths by state
This post was edited on 8/31/20 at 6:33 pm
Posted on 8/31/20 at 6:22 pm to Chromdome35
Absolutely! Thank you
Posted on 8/31/20 at 6:30 pm to AUMIS01
quote:
Nationwide positivity dropped below 5% today, to 4.6%. Just need the stupid death number to drop. We're going to get the sub 1k death day on a normal reporting day sometime this week, as long as Texas doesn't dump all over us.
And that rate was with skewed numbers from Tennessee. 1800 plus new cases out of just 11k tests. But 1000 of the new cases were out of a correctional facility out of around 1500 tests.
Posted on 8/31/20 at 6:33 pm to Athanatos
Athanatos, see my previous response.
I gave you both 7 day avg growth and per capita.
I can change my daily update to be either.
I gave you both 7 day avg growth and per capita.
I can change my daily update to be either.
Posted on 8/31/20 at 6:41 pm to Chromdome35
I’m thinking average growth rate in deaths, since that more accurately shows whether things are getting better or worse. What do you think?
Posted on 8/31/20 at 6:45 pm to AUMIS01
quote:
Nationwide positivity dropped below 5% today, to 4.6%. Just need the stupid death number to drop.
I wish they reported deaths like this so it was clear when the deaths occurred (maybe "in the last seven days" and "outside of the last seven days"), and whether COVID was a real player in the death or not.
Posted on 8/31/20 at 7:03 pm to DougsMugs
Same thought has crossed my mind. COVID, riots, COVID, riots, COVID. Lather, rinse, repeat.

Posted on 8/31/20 at 9:32 pm to AUMIS01
quote:
Same thought has crossed my mind. COVID, riots, COVID, riots, COVID. Lather, rinse, repeat.
If that were the case the why hasn't Oregon exploded. If anything they are behind the curve and should already have reached a "catch up" point.
Posted on 8/31/20 at 10:51 pm to Chromdome35
I printed out tonight’s results and I beat the shite out of people with it
Posted on 9/1/20 at 9:01 am to DMAN1968
Good question, and one I don't have a good answer to. Perhaps weed really is a COVID prophylactic? More likely it's already burned through the professional protest crowd as part of the nationwide spike in June / July. The numbers are pretty obvious that the initial protests caused the spike we're coming out of now.
Posted on 9/1/20 at 9:07 am to AUMIS01
quote:
The numbers are pretty obvious that the initial protests caused the spike we're coming out of now.
I think it's contributed, sure, but there just seems to be such a strong relation between latitude and COVID surges. Warmed in the Sunbelt, and cases went up. Protests don't account for the whole picture there. Once prevalence got high enough, the surge subsided. As the temperatures have risen further north and in Europe, you are seeing rising cases in the Mid-West, France, Spain, etc. I'll have to see if there's an analysis of this theory.
Posted on 9/1/20 at 9:08 am to Athanatos
also, national hospitalizations are now at lowest point since June 30.

This post was edited on 9/1/20 at 9:09 am
Posted on 9/1/20 at 9:33 am to Athanatos
Please do, I've seen some charts that speak to this but without detailed analysis. Summer is almost over and we're just now seeing surges in most of the Midwest states, whereas the sunbelt states all started seeing case growth at exactly the same time. It was incredibly nice here in Georgia in May and we were bumping along at a stable level for a month after the stay at home orders were lifted, then George Floyd, Wendy's, and 4th of July all hit in sequence, and our curve follows those events to a T.
Europe is going to be a tough sell because they didn't really start lifting restrictions until midway through the summer. Their lockdowns were severe, up to and including military lockdown.
Europe is going to be a tough sell because they didn't really start lifting restrictions until midway through the summer. Their lockdowns were severe, up to and including military lockdown.
Posted on 9/1/20 at 10:49 am to BestBanker
quote:
Will this thread reflect the new data by the CDC that indicates death from wuhan virus is @ 6% of what's been mistakenly reported?
You are dead wrong on that. About 92% of the COVID deaths (with or of) were killed by COVID. 8,000 people die in the USA every day. 1,000 people are dying every day of/with covid. But if 1% of Americans have covid at any given time then we would expect 80 random dead people to have covid. Instead we have 1000.
So you can make a case that we’re overstating covid deaths by 8%, not the 94% you imply.
Posted on 9/1/20 at 10:53 am to DougsMugs
quote:
I am concerned that the latest round of protests and getting in faces of Trump supporters will cause a case spike in two weeks.
I doubt it. It looks like a lot on TV but it's peanuts compared to the amount of interaction in the rest of society.

 Page 302 of 331

Popular
Back to top