- My Forums
- Tiger Rant
- LSU Recruiting
- SEC Rant
- Saints Talk
- Pelicans Talk
- More Sports Board
- Fantasy Sports
- Golf Board
- Soccer Board
- O-T Lounge
- Tech Board
- Home/Garden Board
- Outdoor Board
- Health/Fitness Board
- Movie/TV Board
- Book Board
- Music Board
- Political Talk
- Money Talk
- Fark Board
- Gaming Board
- Travel Board
- Food/Drink Board
- Ticket Exchange
- TD Help Board
Customize My Forums- View All Forums
- Show Left Links
- Topic Sort Options
- Trending Topics
- Recent Topics
- Active Topics
Started By
Message
re: Daily COVID Updated as of 11/2/20 8:00 PM
Posted on 7/25/20 at 6:05 pm to Chromdome35
Posted on 7/25/20 at 6:05 pm to Chromdome35
The volume of new cases has definitely flattened out and the growth rate is declining. The testing volume continues to move upwards but the great news is that the daily positivity rate is starting to fall.
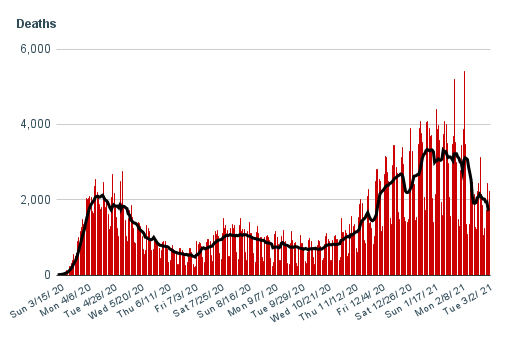
Deaths continue to climb, with today's 1037 representing the highest Saturday since 5/23. The 7 day average for deaths is at 900 which is almost double the all-time low of 478 which occurred on 7/6/20. The number has steadily risen since 7/6.

The positivity rate chart is teasing a downward trend.

If the New Cases curve starts declining then we should expect to see the death curve start falling as well, but if it follows the pattern, it will be roughly 3 weeks behind the downturn in the New Cases curve. If you look at this near term graph of the 7-day average cases and deaths, you can see the death curve is roughly 3-4 weeks behind the New Cases curve.
The New Cases curve started leveling out around 7/19, 3 weeks from that date is August 9th. It will be interesting to see if the pattern holds.

The mortality rate continues to fall; however, if you examine the curve you can see that the decline is starting to lessen.

Florida, Arizona, California, Texas and Mississippi are the top 5 impact states for the day.
Deaths continue to climb, with today's 1037 representing the highest Saturday since 5/23. The 7 day average for deaths is at 900 which is almost double the all-time low of 478 which occurred on 7/6/20. The number has steadily risen since 7/6.
The positivity rate chart is teasing a downward trend.
If the New Cases curve starts declining then we should expect to see the death curve start falling as well, but if it follows the pattern, it will be roughly 3 weeks behind the downturn in the New Cases curve. If you look at this near term graph of the 7-day average cases and deaths, you can see the death curve is roughly 3-4 weeks behind the New Cases curve.
The New Cases curve started leveling out around 7/19, 3 weeks from that date is August 9th. It will be interesting to see if the pattern holds.
The mortality rate continues to fall; however, if you examine the curve you can see that the decline is starting to lessen.
Florida, Arizona, California, Texas and Mississippi are the top 5 impact states for the day.
This post was edited on 7/25/20 at 6:12 pm
 2
2

Posted on 7/25/20 at 6:19 pm to oklahogjr
quote:
was thst just based on your opinion?
That was my feeling 3-4 months ago, obviously I was wrong.
Posted on 7/25/20 at 8:05 pm to Chromdome35
Didn't get any kind of weekend dip in numbers really here unless they explode on monday. i'm hoping for just a slight uptick or maybe slow monday/tuesday if there is less catchup from weekend.

Posted on 7/25/20 at 8:16 pm to oklahogjr
nationwide hospitalizations have declined today. great sign.

Posted on 7/25/20 at 8:16 pm to Chromdome35
Also California dumping data now doesn't help either.
From the worldometers site for 7/25/20:
NOTE: California: Los Angeles County: "Public Health Reports 53 New Deaths and 3,628 New Cases of Confirmed COVID-19 in Los Angeles County - High case numbers are reflective of a backlog of positive results due to a resolution in the State reporting system that affected the past few days of reported data"
LINK
This post was edited on 7/25/20 at 8:17 pm
Posted on 7/25/20 at 9:09 pm to tgrgrd00
hospitalizations heading down and death reports catching up both very good signs. cases trending down . sounds like we're gonna be around that 3 week window mentioned by chromedome.

Posted on 7/26/20 at 2:29 pm to Chromdome35
Chrome, question for you on these heatmaps. Could you produce a similar map that compares the daily number vs the 7 day average, then do a red to blue scale based on whether the state is beating their 7 day avg or not on cases and deaths?
Posted on 7/26/20 at 3:00 pm to AUin02
hmmmm, let me ponder that, maybe...
Posted on 7/26/20 at 5:14 pm to Chromdome35
This is the link to the COVID-19 tracker that I have created and shared on Google Drive.
If you want to view the shared sheet, follow this link COVID-19 Tracker
If you want to download a copy of this sheet and manipulate it follow this link Downloadable COVID-19 Tracker
The source for the data is from https://covidtracking.com/data/


New Cases by State

New Deaths by State

7-day average growth rate of new cases

If you want to view the shared sheet, follow this link COVID-19 Tracker
If you want to download a copy of this sheet and manipulate it follow this link Downloadable COVID-19 Tracker
The source for the data is from https://covidtracking.com/data/
New Cases by State
New Deaths by State
7-day average growth rate of new cases
Posted on 7/26/20 at 5:25 pm to AUin02
quote:
Could you produce a similar map that compares the daily number vs the 7 day average, then do a red to blue scale based on whether the state is beating their 7 day avg or not on cases and deaths?
Seems like that is only giving you a trend for one day compared to one week.
Posted on 7/26/20 at 5:38 pm to Rocco Lampone
You could do it where you calculate the variance for each day, then heatmap each daily variance. It would show you the general trend for the state.
Posted on 7/26/20 at 6:07 pm to Chromdome35
I can't overstate how important the next 7-10 days are. The numbers are teasing us heading back down, especially with most cases and deaths backdated, with minimal shutdowns re-implemented. That bodes very well that the transmission chains are being broken slowly but surely.
Thanks for your work Chrome, your trending metrics are phenomenal.
Thanks for your work Chrome, your trending metrics are phenomenal.

Posted on 7/27/20 at 9:25 am to AUMIS01
quote:
I can't overstate how important the next 7-10 days are.
agreed. we need to see a high volume of tests with declining positive rates.
schools and fear porn lovers are hoping for big spikes so they can push everything back in to October/November.
Posted on 7/27/20 at 1:14 pm to AUMIS01
quote:
I can't overstate how important the next 7-10 days are. The numbers are teasing us heading back down, especially with most cases and deaths backdated, with minimal shutdowns re-implemented. That bodes very well that the transmission chains are being broken slowly but surely.
Thanks for your work Chrome, your trending metrics are phenomenal.
Indeed. We are going to beat this thing through common sense until we get a vaccine. Wear a mask in public, maintain a safe distance, and generally don't do something that begs to get infected.
If we do that we will be back in business in a couple of weeks. Yes, there will be outbreaks where a section has to shut things down until we get the vaccine but the country as a whole will be doing alright.
Posted on 7/27/20 at 1:31 pm to Arksulli
So you are basically saying you want to do this for years? Just wait until November 4th, and you won't have to fear after that.

Posted on 7/27/20 at 1:55 pm to Crimsonians
Yeah, we will get to herd immunity before a vaccine.
Posted on 7/27/20 at 5:15 pm to Chromdome35
This is the link to the COVID-19 tracker that I have created and shared on Google Drive.
If you want to view the shared sheet, follow this link COVID-19 Tracker
If you want to download a copy of this sheet and manipulate it follow this link Downloadable COVID-19 Tracker
The source for the data is from https://covidtracking.com/data/


New Cases by State
New Deaths by State
7-day average growth rate of new cases
If you want to view the shared sheet, follow this link COVID-19 Tracker
If you want to download a copy of this sheet and manipulate it follow this link Downloadable COVID-19 Tracker
The source for the data is from https://covidtracking.com/data/
New Cases by State
New Deaths by State
7-day average growth rate of new cases
Posted on 7/27/20 at 5:19 pm to Chromdome35
So Texas changed the way they report deaths today and added 675 Deaths, last Monday Texas had 62. Before today, the 7 day average deaths for Texas was 154, so we can say that today's death toll of 1059 is overstated by 521. That would make today's actual death toll at 538 which is substantially higher than last Monday's 362 but well below the 7 day average of 904. Keep in mind that Monday's are always down.
The positivity rate continues to drop.
The positivity rate continues to drop.
Posted on 7/27/20 at 5:20 pm to Chromdome35
Those deaths are very inaccurate.
Did your site have a dump?
I see the edit. I knew it was wrong. WOM won't add those.
Did your site have a dump?
I see the edit. I knew it was wrong. WOM won't add those.
This post was edited on 7/27/20 at 5:22 pm
Posted on 7/27/20 at 5:22 pm to Crimsonians
From the Texas Dept of Health Website
https://txdshs.maps.arcgis.com/apps/opsdashboard/index.html#/ed483ecd702b4298ab01e8b9cafc8b83
quote:
July 27: DSHS is now reporting COVID-19 fatality data based on death certificates. A fatality is counted as a COVID-19 fatality when the medical certifier attests on the death certificate that COVID-19 is a cause of death.
Death certificate data has identified 5,713 fatalities among Texas residents, including 44 newly reported Monday. That compares with 5,038 deaths reported Sunday under the previous method.
https://txdshs.maps.arcgis.com/apps/opsdashboard/index.html#/ed483ecd702b4298ab01e8b9cafc8b83

 Page 273 of 331

Popular
Back to top