




 1
1





- My Forums
- Tiger Rant
- LSU Recruiting
- SEC Rant
- Saints Talk
- Pelicans Talk
- More Sports Board
- Fantasy Sports
- Golf Board
- Soccer Board
- O-T Lounge
- Tech Board
- Home/Garden Board
- Outdoor Board
- Health/Fitness Board
- Movie/TV Board
- Book Board
- Music Board
- Political Talk
- Money Talk
- Fark Board
- Gaming Board
- Travel Board
- Food/Drink Board
- Ticket Exchange
- TD Help Board
Customize My Forums- View All Forums
- Show Left Links
- Topic Sort Options
- Trending Topics
- Recent Topics
- Active Topics
Started By
Message
re: Daily COVID Updated as of 11/2/20 8:00 PM
Posted on 4/16/20 at 9:50 pm to tiger91
Posted on 4/16/20 at 9:50 pm to tiger91
quote:Hmm. Are you talking about the last chart in the post 8 above yours? The CFR chart? I didn't see where anyone put a label on it, but in stocks you might call it a teacup pattern, and in engineering you might call it a bathtub.
Chrome someone called that last graph a name — meaning the shape of the curve is called ________??
Want to say it starts with an L
But I don't think you can draw any conclusions based on the shape of that plot because it is a function of two variables over time. Both variables can only ever increase, but one drags the plot up and the other drags the plot down. The shape mainly depends on how aggressive we are at counting each of the variables.
Edit: Thinking about it more, since CFR is really a measure of outcomes, the data should really be plotted only after the case has an outcome. In other words, instead of plotting deaths / cases, it might be more meaningful to plot deaths / (deaths + recoveries). And "recoveries" should include asymptomatic cases, assuming it's even possible to get a reliable number for those.
This post was edited on 4/16/20 at 9:58 pm
Posted on 4/16/20 at 9:56 pm to Korkstand
Yes that one — it sort of does look like a teacup.
Posted on 4/17/20 at 12:14 am to buckeye_vol
quote:Weren't they all added to the 14th, and on the 15th they just began adding the probables to their regular daily totals?
because of the deaths being added to the 14th and 15th
quote:
you may want to get a moving median or a trimmed average (e.g., exclude highest and lowest days, then average of 5 remaining days) until (if) those deaths are properly distributed to their correct days.
Or maybe we can add an adjustments column to the spreadsheet to estimate the distribution?
Put a negative adjustment of 3,778 on April 14th, then put a positive adjustment of 3,778 * ( day_x_deaths / mar_11-apr_14_total_deaths) on each day from March 11 through April 14. Just dividing up those extra deaths proportionally according to each day's death total.
Posted on 4/17/20 at 5:51 am to Chromdome35
We've reached the 1/1000% of the population dead piont.
Must be why the piles of dead bodies on my street have gotten so high...
Must be why the piles of dead bodies on my street have gotten so high...
Posted on 4/17/20 at 6:57 am to Knight of Old
Thank you for the stellar commentary and contribution to the thread.
Posted on 4/17/20 at 9:04 am to Chromdome35
The "US Mortality Rate" chart should be titled "US Mortality Rate of Reported Cases".
Too many people are jumping to the conclusion that this is the mortality rate of the entire US population that is infected with COVID. We don't know that number. However we can logically imply that the number is pretty big, i.e., making the denominator much bigger based on an R0 value for COVID of 5.7. That's almost 4 times more infectious than influenza. I don't believe it is too much of a logical stretch to imply that a more infectious virus with a higher R0 number has infected more people than a virus with a lesser R0 number.
Too many people are jumping to the conclusion that this is the mortality rate of the entire US population that is infected with COVID. We don't know that number. However we can logically imply that the number is pretty big, i.e., making the denominator much bigger based on an R0 value for COVID of 5.7. That's almost 4 times more infectious than influenza. I don't believe it is too much of a logical stretch to imply that a more infectious virus with a higher R0 number has infected more people than a virus with a lesser R0 number.
Posted on 4/17/20 at 9:43 am to GumboPot
I totally agree that the observed mortality rate is grossly inflated. I did a simple reverse calculation to determine mortality based on the % of tests that are coming back positive. I ran it including and excluding NY data.

Posted on 4/17/20 at 9:47 am to Chromdome35
Small sample yes but here’s some encouraging numbers from Metro Nashville.
Wednesday’s numbers in Nashville.
Total cases: 1,492
Recovered: 324
Deaths: 17
Total active cases: 1,151
Thursday’s numbers:
Total cases: 1,560
RECOVERED: 677 (up 353 from Wednesday)
Deaths: 18
Total active cases: 865 (down 286 from Thursday)
Today’s numbers:
Total cases: 1,597 (up 37)
Recovered: 825 (up 148)
Deaths: 20 (up 2)
Active cases: 752 (down 113)
Recovered cases now represent more than half of the total cases in Nashville. Recoveries outpaced new cases by a 4-1 clip.
Probably stayed on this thread before, but I think recoveries are being far understated nationwide.
Wednesday’s numbers in Nashville.
Total cases: 1,492
Recovered: 324
Deaths: 17
Total active cases: 1,151
Thursday’s numbers:
Total cases: 1,560
RECOVERED: 677 (up 353 from Wednesday)
Deaths: 18
Total active cases: 865 (down 286 from Thursday)
Today’s numbers:
Total cases: 1,597 (up 37)
Recovered: 825 (up 148)
Deaths: 20 (up 2)
Active cases: 752 (down 113)
Recovered cases now represent more than half of the total cases in Nashville. Recoveries outpaced new cases by a 4-1 clip.
Probably stayed on this thread before, but I think recoveries are being far understated nationwide.
Posted on 4/17/20 at 9:54 am to Chromdome35

Posted on 4/17/20 at 9:59 am to GumboPot
Hows Nola doing?
Posted on 4/17/20 at 10:07 am to LosLobos111
The nursing home where I do contract work -- I checked the iso unit this via EMR and we now have 12 positive cases. 12 of 79 residens. Last night I posted that it was 9 - evidently some results were returned/called in during the night shift.
Two are now in the hospital -- one just refuses to keep his oxygen on and as he was a full code, our staff felt better with him being in the hospital. The other was in the hospital (not sure what his circumstances were) after his test but before his results came back.
15% of our residents are positive. A couple I'm thinking from what I can read about their condition won't make it.
Two are now in the hospital -- one just refuses to keep his oxygen on and as he was a full code, our staff felt better with him being in the hospital. The other was in the hospital (not sure what his circumstances were) after his test but before his results came back.
15% of our residents are positive.
A couple I'm thinking from what I can read about their condition won't make it.This post was edited on 4/17/20 at 10:11 am
Posted on 4/17/20 at 11:06 am to LosLobos111
quote:
Hows Nola doing?
Confirmed cases: 5,847
Deaths: 302
LINK
Current models expect 1,141 COVID-19 deaths projected by August 4, 2020 for Louisiana.
This post was edited on 4/17/20 at 11:10 am
Posted on 4/17/20 at 11:07 am to tiger91
It’s probably going to get worse. You’re at the point that you’re likely going to hit a 50% infection rate based on other homes I’ve seen.
Posted on 4/17/20 at 11:12 am to the808bass
bass it looks like they're testing left and right. One temp above their normal range and you're getting swabbed. Which I'm fine with.
No one other than employees, xray tech, lab person has been allowed in since March 11. Not sure how deliveries are handled -- I just know they received 4 pallets on Wednesday of supplies. And I'm assuming that the vending machine people aren't coming to refill those.
I was able to find thermometers that they needed and got those to them -- just wish I could do more.
No one other than employees, xray tech, lab person has been allowed in since March 11. Not sure how deliveries are handled -- I just know they received 4 pallets on Wednesday of supplies. And I'm assuming that the vending machine people aren't coming to refill those.
I was able to find thermometers that they needed and got those to them -- just wish I could do more.
Posted on 4/17/20 at 11:30 am to tiger91
You’re not an anomaly, unfortunately.
I was listening to a presentation from a local county executive in Missouri. They had 90-some cases and he indicated that over half of them were “confined.” That’s pretty much SNFs and prisons. And I’m guessing mostly SNF.
We’ll probably see that over 15% of infections were tied to senior living.
I was listening to a presentation from a local county executive in Missouri. They had 90-some cases and he indicated that over half of them were “confined.” That’s pretty much SNFs and prisons. And I’m guessing mostly SNF.
We’ll probably see that over 15% of infections were tied to senior living.
Posted on 4/17/20 at 12:07 pm to Chromdome35
This is the link to the US state level tracker that I have shared via Google Drive. Chromdome's State Level COVID-19 Daily Tracker
This is the link to the COVID-19 Country tracker that I have shared on Google Drive. Chromdome's COVID-19 Daily Tracker
The source for the data is https://www.worldometers.info/coronavirus/
The source for the testing data is from https://covidtracking.com/data/
NOTE: The daily growth rate data will not be accurate until the end of the day's postings. It will change throughout the day.
NOTE: I am not a mathematician, statistics guru, scientist, sharpest tack in the box, I'm just a guy who likes to understand for myself what is happening and to share it with others. This thread was not created to debate if you should or shouldn't take this seriously, it is simply to present the numbers and foster conversation.

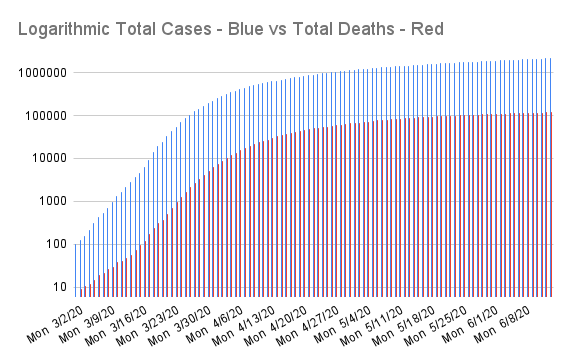


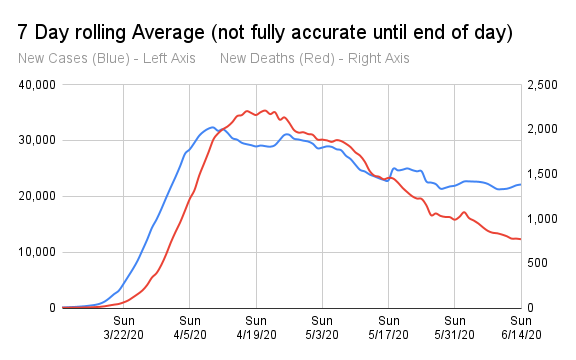
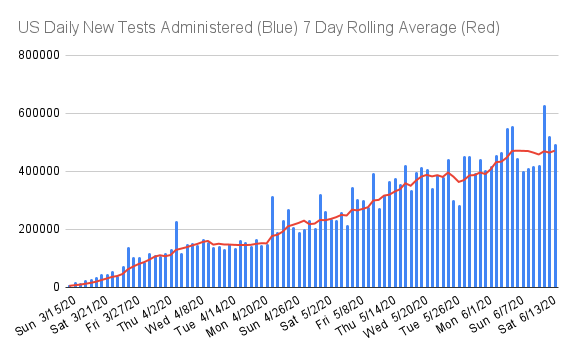
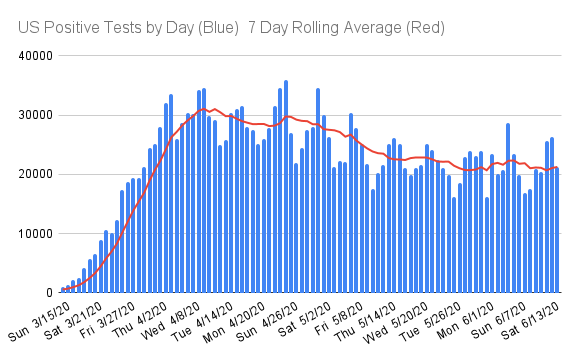

This is the link to the COVID-19 Country tracker that I have shared on Google Drive. Chromdome's COVID-19 Daily Tracker
The source for the data is https://www.worldometers.info/coronavirus/
The source for the testing data is from https://covidtracking.com/data/
NOTE: The daily growth rate data will not be accurate until the end of the day's postings. It will change throughout the day.
NOTE: I am not a mathematician, statistics guru, scientist, sharpest tack in the box, I'm just a guy who likes to understand for myself what is happening and to share it with others. This thread was not created to debate if you should or shouldn't take this seriously, it is simply to present the numbers and foster conversation.
Posted on 4/17/20 at 12:20 pm to Chromdome35
I have adjusted the 7 day rolling average formula to omit the cases & death values from the 14th and 15th.
The rolling averages will continue to omit these values until we're 7 days past them in the models.
For the 14th: Based on previous 6 days (8th - 13th)
For the 15th: Based on the previous 5 days before the 14th (9th - 13th)
For the 16th: Based on the average of the 16th, 13th, 12th, 11th, 10th, 9th and 8th.
For the 17th: Based on the average of the 17th, 16th, 13th, 12th, 11th, 10th, and 9th.
The rolling averages will continue to omit these values until we're 7 days past them in the models.
For the 14th: Based on previous 6 days (8th - 13th)
For the 15th: Based on the previous 5 days before the 14th (9th - 13th)
For the 16th: Based on the average of the 16th, 13th, 12th, 11th, 10th, 9th and 8th.
For the 17th: Based on the average of the 17th, 16th, 13th, 12th, 11th, 10th, and 9th.
This post was edited on 4/17/20 at 12:21 pm
Posted on 4/17/20 at 1:59 pm to Chromdome35
Dang it Asa he said we had all gaiting complete
But kept us from Phase 1 until May 4th because of the fricking prisons
But kept us from Phase 1 until May 4th because of the fricking prisons
Posted on 4/17/20 at 3:45 pm to Chromdome35
New Yorks numbers look fricked today. 1k+ deaths and less than 400 cases??? What sorcery are they doing over there.
Posted on 4/17/20 at 4:03 pm to TigerMan327
The numbers are bullshite this whole thing is a giant clusterfrick. Its a waste of time trying to figure this shitstorm out. 

 Page 182 of 331



Popular

Back to top
 Follow TigerDroppings for LSU Football News