




 2
2





- My Forums
- Tiger Rant
- LSU Recruiting
- SEC Rant
- Saints Talk
- Pelicans Talk
- More Sports Board
- Fantasy Sports
- Golf Board
- Soccer Board
- O-T Lounge
- Tech Board
- Home/Garden Board
- Outdoor Board
- Health/Fitness Board
- Movie/TV Board
- Book Board
- Music Board
- Political Talk
- Money Talk
- Fark Board
- Gaming Board
- Travel Board
- Food/Drink Board
- Ticket Exchange
- TD Help Board
Customize My Forums- View All Forums
- Show Left Links
- Topic Sort Options
- Trending Topics
- Recent Topics
- Active Topics
Started By
Message
re: Daily COVID Updated as of 11/2/20 8:00 PM
Posted on 4/16/20 at 5:09 pm to Chromdome35
Posted on 4/16/20 at 5:09 pm to Chromdome35
This is the link to the US state level tracker that I have shared via Google Drive. Chromdome's State Level COVID-19 Daily Tracker
This is the link to the COVID-19 Country tracker that I have shared on Google Drive. Chromdome's COVID-19 Daily Tracker
The source for the data is https://www.worldometers.info/coronavirus/
The source for the testing data is from https://covidtracking.com/data/
NOTE: The daily growth rate data will not be accurate until the end of the day's postings. It will change throughout the day.
NOTE: I am not a mathematician, statistics guru, scientist, sharpest tack in the box, I'm just a guy who likes to understand for myself what is happening and to share it with others. This thread was not created to debate if you should or shouldn't take this seriously, it is simply to present the numbers and foster conversation.
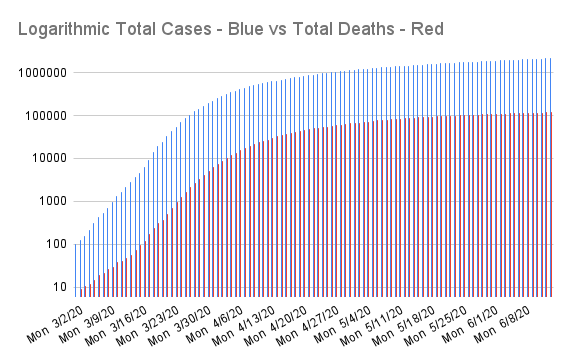
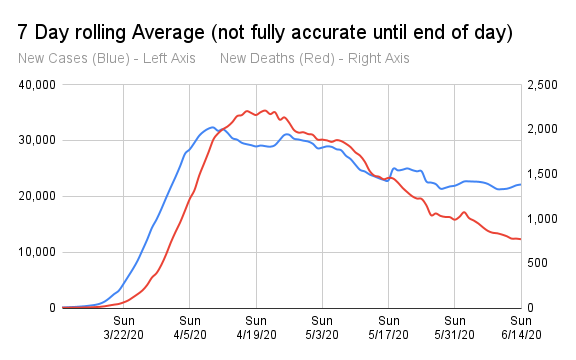
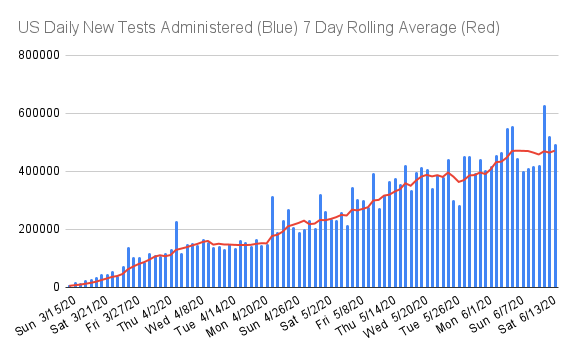
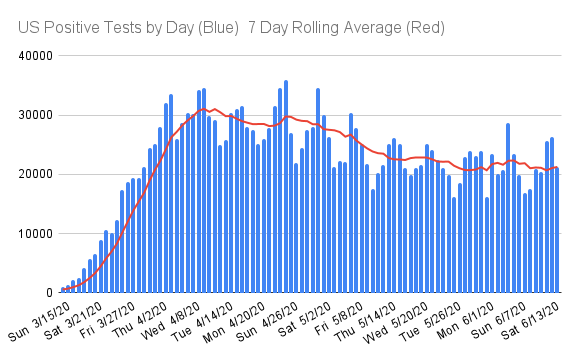
NOTE: 4/15/20 I am changing the graphs in these posts. The Daily Growth Rate of Cases graph is not meaningful at this point. I am replacing it with a graph showing a 7 day rolling average of new cases and deaths. I'm also adding a couple of graphs to show # of tests given and the # of positive test results by day.




This is the link to the COVID-19 Country tracker that I have shared on Google Drive. Chromdome's COVID-19 Daily Tracker
The source for the data is https://www.worldometers.info/coronavirus/
The source for the testing data is from https://covidtracking.com/data/
NOTE: The daily growth rate data will not be accurate until the end of the day's postings. It will change throughout the day.
NOTE: I am not a mathematician, statistics guru, scientist, sharpest tack in the box, I'm just a guy who likes to understand for myself what is happening and to share it with others. This thread was not created to debate if you should or shouldn't take this seriously, it is simply to present the numbers and foster conversation.
NOTE: 4/15/20 I am changing the graphs in these posts. The Daily Growth Rate of Cases graph is not meaningful at this point. I am replacing it with a graph showing a 7 day rolling average of new cases and deaths. I'm also adding a couple of graphs to show # of tests given and the # of positive test results by day.
Posted on 4/16/20 at 5:25 pm to Chromdome35
What is the explanation for 6k+ deaths on Tuesday?
Is that the NYC body dump of people never tested but assumed to have died from COVID-19?
Is that the NYC body dump of people never tested but assumed to have died from COVID-19?
Posted on 4/16/20 at 5:40 pm to Jinglebob
Yes.
Posted on 4/16/20 at 5:56 pm to Jinglebob
quote:Yeah. I am assuming/hoping they will eventually revise those numbers to attribute them to the correct day.
What is the explanation for 6k+ deaths on Tuesday?
Is that the NYC body dump of people never tested but assumed to have died from COVID-19?
Posted on 4/16/20 at 5:56 pm to Jinglebob
The explanation is here: https://www.worldometers.info/coronavirus/us-data/
Posted on 4/16/20 at 5:57 pm to Korkstand
It totally fricks the numbers up from a tracking standpoint. Ruins the run rates, averages, growth rates, days to double...
Posted on 4/16/20 at 6:01 pm to Chromdome35
New York fricking sucks.
Posted on 4/16/20 at 6:03 pm to Chromdome35
Any idea how they are determining 15 day new case decline?
Is it just a lower number on day 15 than day 1?
Based on your data that looks like AR can enter phase 1 tomorrow.
Are you taking requests for new states to add?
I think your source data only gives cumulative totals and daily new cases, it doesn't keep a history of previous days' new cases
Is it just a lower number on day 15 than day 1?
Based on your data that looks like AR can enter phase 1 tomorrow.
Are you taking requests for new states to add?
I think your source data only gives cumulative totals and daily new cases, it doesn't keep a history of previous days' new cases
This post was edited on 4/16/20 at 6:08 pm
Posted on 4/16/20 at 6:42 pm to Ingloriousbastard
Now that there is a plan in place for getting back to work, we should just focus in on specific states. Total numbers aren't all that meaningful now.
We will know by the end of the month the states that open into Phase 1 and who are not there yet.
We will know by the end of the month the states that open into Phase 1 and who are not there yet.
Posted on 4/16/20 at 8:04 pm to uppermidwestbama
It's interesting to consider the timing of the revision to the CDC classification guideline which caused a large bump in the number of deaths right before the 14-day gates were put in place.
That could cause some states 14 day counter to reset to 0, it could also give a state like NY a more defined starting point to show a decline from.
That could cause some states 14 day counter to reset to 0, it could also give a state like NY a more defined starting point to show a decline from.
Posted on 4/16/20 at 8:17 pm to Chromdome35
This is the link to the US state level tracker that I have shared via Google Drive. Chromdome's State Level COVID-19 Daily Tracker
This is the link to the COVID-19 Country tracker that I have shared on Google Drive. Chromdome's COVID-19 Daily Tracker
The source for the data is https://www.worldometers.info/coronavirus/
The source for the testing data is from https://covidtracking.com/data/
NOTE: The daily growth rate data will not be accurate until the end of the day's postings. It will change throughout the day.
NOTE: I am not a mathematician, statistics guru, scientist, sharpest tack in the box, I'm just a guy who likes to understand for myself what is happening and to share it with others. This thread was not created to debate if you should or shouldn't take this seriously, it is simply to present the numbers and foster conversation.
NOTE: 4/15/20 I am changing the graphs in these posts. The Daily Growth Rate of Cases graph is not meaningful at this point. I am replacing it with a graph showing a 7 day rolling average of new cases and deaths. I'm also adding a couple of graphs to show # of tests given and the # of positive test results by day.

This is the link to the COVID-19 Country tracker that I have shared on Google Drive. Chromdome's COVID-19 Daily Tracker
The source for the data is https://www.worldometers.info/coronavirus/
The source for the testing data is from https://covidtracking.com/data/
NOTE: The daily growth rate data will not be accurate until the end of the day's postings. It will change throughout the day.
NOTE: I am not a mathematician, statistics guru, scientist, sharpest tack in the box, I'm just a guy who likes to understand for myself what is happening and to share it with others. This thread was not created to debate if you should or shouldn't take this seriously, it is simply to present the numbers and foster conversation.
NOTE: 4/15/20 I am changing the graphs in these posts. The Daily Growth Rate of Cases graph is not meaningful at this point. I am replacing it with a graph showing a 7 day rolling average of new cases and deaths. I'm also adding a couple of graphs to show # of tests given and the # of positive test results by day.
Posted on 4/16/20 at 8:18 pm to Chromdome35
Some states reported some numbers today, who knows if they mean anything...
Posted on 4/16/20 at 8:21 pm to Chromdome35
Chrome, because of the deaths being added to the 14th and 15th, which really messes up a moving average, you may want to get a moving median or a trimmed average (e.g., exclude highest and lowest days, then average of 5 remaining days) until (if) those deaths are properly distributed to their correct days.
Posted on 4/16/20 at 8:24 pm to buckeye_vol
I was thinking about doing a weighted average and assigning those two days a lower weighting value than they would otherwise get.
Posted on 4/16/20 at 8:28 pm to Chromdome35
quote:The problem with that is there is no way to assign a weight that isn’t arbitrary.
I was thinking about doing a weighted average and assigning those two days a lower weighting value than they would otherwise get.
Posted on 4/16/20 at 8:37 pm to Chromdome35
All in all, not a bad day.
This post was edited on 4/16/20 at 8:47 pm
Posted on 4/16/20 at 8:50 pm to Ingloriousbastard
quote:This is extremely high profile public data. How dumb would someone have to be to even try to fake it? What sane person could possibly think that no one would ever find out?
I’m concerned that some states could be “gaming” the numbers to fit certain agendas. Maybe I’m wrong.
Edit: Caught it before the edit. Should I delete?
This post was edited on 4/16/20 at 8:51 pm
Posted on 4/16/20 at 9:19 pm to buckeye_vol
It would also work to just exclude those two days from a 7 day rolling average. So it would be a 9 day rolling average with those two values excluded.
Posted on 4/16/20 at 9:23 pm to Chromdome35
Chrome someone called that last graph a name — meaning the shape of the curve is called ________??
Want to say it starts with an L
Also of our 79 residents, 9 are positive and 2 have gone to the hospital (one was actually there when his result came bakc) but the other was sent out today only as he was a full code and our RNs had done all that they could and didn’t want him crashing there.
Lots and lots of diarrrhea with this virus — no cnas, no housekeepers, no nobody on the iso unit except for nurses. Imagine one confused resident going into another ones room, while leaving a trail of crap only to sit in another residents bed that it too is full of crap from the resident who just on her own got out of that bed. Confused people who are biting the tips of their nasal cannula off (disgusting) and don’t understand why they need to keep it on.
All the while not one tick tock video and no complaining. I did indeed bring them Tito’s and some 2 oz medicine bottles for dividing it up with cans of lemonade and chips so that they could take it home at the end of their shift.
This sucks so bad — the rest of our residents are confined to their rooms and are getting hit with depression, lack of intake etc. firsntpositive wssnt until like April 8 and no one other than staff, lab people, X-ray people had been in the facility since March 11.
Very tough times and I’m thinking that four of our positives won’t make it — and three of those really weren’t anywhere near death a month ago. One was already looking not great.
Want to say it starts with an L
Also of our 79 residents, 9 are positive and 2 have gone to the hospital (one was actually there when his result came bakc) but the other was sent out today only as he was a full code and our RNs had done all that they could and didn’t want him crashing there.
Lots and lots of diarrrhea with this virus — no cnas, no housekeepers, no nobody on the iso unit except for nurses. Imagine one confused resident going into another ones room, while leaving a trail of crap only to sit in another residents bed that it too is full of crap from the resident who just on her own got out of that bed. Confused people who are biting the tips of their nasal cannula off (disgusting) and don’t understand why they need to keep it on.
All the while not one tick tock video and no complaining. I did indeed bring them Tito’s and some 2 oz medicine bottles for dividing it up with cans of lemonade and chips so that they could take it home at the end of their shift.
This sucks so bad — the rest of our residents are confined to their rooms and are getting hit with depression, lack of intake etc. firsntpositive wssnt until like April 8 and no one other than staff, lab people, X-ray people had been in the facility since March 11.
Very tough times and I’m thinking that four of our positives won’t make it — and three of those really weren’t anywhere near death a month ago. One was already looking not great.

 Page 181 of 331



Popular

Back to top
 Follow TigerDroppings for LSU Football News