




- My Forums
- Tiger Rant
- LSU Recruiting
- SEC Rant
- Saints Talk
- Pelicans Talk
- More Sports Board
- Fantasy Sports
- Golf Board
- Soccer Board
- O-T Lounge
- Tech Board
- Home/Garden Board
- Outdoor Board
- Health/Fitness Board
- Movie/TV Board
- Book Board
- Music Board
- Political Talk
- Money Talk
- Fark Board
- Gaming Board
- Travel Board
- Food/Drink Board
- Ticket Exchange
- TD Help Board
Customize My Forums- View All Forums
- Show Left Links
- Topic Sort Options
- Trending Topics
- Recent Topics
- Active Topics
Started By
Message
re: Louisiana COVID-19 - August 13, 2020 Update: 135,439 cases - 4279 deaths - 1,615,980 tests
Posted on 8/13/20 at 4:10 pm to tigerskin
Posted on 8/13/20 at 4:10 pm to tigerskin
Right. I think he said it on Saturday the 11th and closed them on the 13th.
The 13th was also the highest single day for cases (date corrected), it was a Monday.
Distance is far more effective than masks. That is what has always been said. Masks are giving some a false sense of security in some cases.
The 13th was also the highest single day for cases (date corrected), it was a Monday.
Distance is far more effective than masks. That is what has always been said. Masks are giving some a false sense of security in some cases.
This post was edited on 8/13/20 at 4:11 pm
 0
0

Posted on 8/13/20 at 4:11 pm to tigerskin
The SC "masks work" line only documents that you can cherry pick statistics to prove any point. How on earth did the "total number of COVID-19 cases" decrease? They perhaps meant "active" cases, but the way it is worded could just as easily mean what they say and that they removed duplicates so that the total number did indeed decrease. For the counties without mandates that saw increased numbers, key in on the fact that they are using percentages. Those counties could have gone from 3 cases to 4, an increase of 33%.
Bottom line is if they have to cherry pick numbers, they don't have any statistical impact.
Bottom line is if they have to cherry pick numbers, they don't have any statistical impact.


Posted on 8/13/20 at 6:40 pm to TigerMomma4
Did they ever update numbers?
Posted on 8/13/20 at 6:48 pm to Oilfieldbiology
quote:
Did they ever update numbers?
yes... page 6
quote:
1,281 in hospitals (-39), 196 on vents (-15)
Posted on 8/13/20 at 6:51 pm to rt3
Thanks. Great numbers all around.
Posted on 8/13/20 at 6:53 pm to Oilfieldbiology
Louisiana Ro at 0.88
4th best in USA
4th best in USA
This post was edited on 8/13/20 at 6:54 pm

Posted on 8/13/20 at 6:54 pm to tigerskin
quote:BUT BUt JBE yelled at me and said we were #1 in cases!!!!!
Louisiana Ro at 0.88
4th best way in USA
We gonna die
Posted on 8/13/20 at 6:55 pm to lsupride87
Definitely bizarre that they will emphasize Ro when bad but not a peep when it is very good.


Posted on 8/13/20 at 6:58 pm to tigerskin
How is R0 calculated?
This post was edited on 8/13/20 at 6:59 pm
Posted on 8/13/20 at 7:06 pm to hendersonshands

Posted on 8/13/20 at 7:32 pm to tigerskin
But jbe says we are still not doing enough.
Posted on 8/13/20 at 7:58 pm to hendersonshands
:  It’s a guess based on a few parameters.
It’s a guess based on a few parameters. 
Posted on 8/13/20 at 9:32 pm to tigerskin
quote:
20% masks and distancing to get to immunity
That's not immunity.
The second you stop doing that or someone infected gets in, your back to square one.
See New Zealand.
See Hawaii.
Posted on 8/13/20 at 10:02 pm to Privateer 2007
That is why it is called population immunity and not herd immunity.
Although population immunity can still deal with someone infected coming in.
I didn’t say it was ideal.....but it is better than nothing
Although population immunity can still deal with someone infected coming in.
I didn’t say it was ideal.....but it is better than nothing
This post was edited on 8/13/20 at 10:05 pm

Posted on 8/14/20 at 8:01 am to tigerskin
quote:
tigerskin
Here is what I was talking about yesterday, in regards to Kansas officials lying to "prove" masks work.
Showed this chart in a presentation to compare counties with vs. without mandates:

The lines use two different y-axes. Red line goes with the left, starts at 25 finishes at 16. Blue line goes with the right, starts at >9 and ends at 9. (What do you want to bet that the places with mandates are the population centers, and those without are the rural areas?)
Being deceptive just with that.
However, folks have tried to reconstruct the graphs using the same axis for both, and then also expanded the time series to actually include with the mask mandates went into effect.
This is how that looks:

Masks work so well, we have to pull two deceptions to prove it!

Posted on 8/14/20 at 8:08 am to Sasquatch Smash
Wow!
Nice work.
Nice work.
Posted on 8/14/20 at 8:10 am to Bullfrog
quote:
Nice work.
Haha. It isn't my work. Found it on the Twitter.
These folks, The Sentinel, did the work.

Posted on 8/14/20 at 8:19 am to Sasquatch Smash
quote:
Here is what I was talking about yesterday, in regards to Kansas officials lying to "prove" masks work.
Showed this chart in a presentation to compare counties with vs. without mandates:
The lines use two different y-axes. Red line goes with the left, starts at 25 finishes at 16. Blue line goes with the right, starts at >9 and ends at 9. (What do you want to bet that the places with mandates are the population centers, and those without are the rural areas?)
Being deceptive just with that.
However, folks have tried to reconstruct the graphs using the same axis for both, and then also expanded the time series to actually include with the mask mandates went into effect.
This is how that looks:
Masks work so well, we have to pull two deceptions to prove it!
I get what you’re saying and agree this could be extremely misleading to some folks. However, and with no knowledge of the situation other than this single post, I interpret the point of overlapping trend lines involving multiple axes as being to show just that - the trend. To me (a non-conspiracy theorist), the graph represents the success in masks’ impact on trend versus that of no masks.

Posted on 8/14/20 at 8:47 am to AmosMosesAndTwins
quote:
I get what you’re saying and agree this could be extremely misleading to some folks. However


Posted on 8/14/20 at 8:58 am to AmosMosesAndTwins
quote:Man, that's great.
I get what you’re saying and agree this could be extremely misleading to some folks. However, and with no knowledge of the situation other than this single post, I interpret the point of overlapping trend lines involving multiple axes as being to show just that - the trend. To me (a non-conspiracy theorist), the graph represents the success in masks’ impact on trend versus that of no masks.
You should teach a spin class.
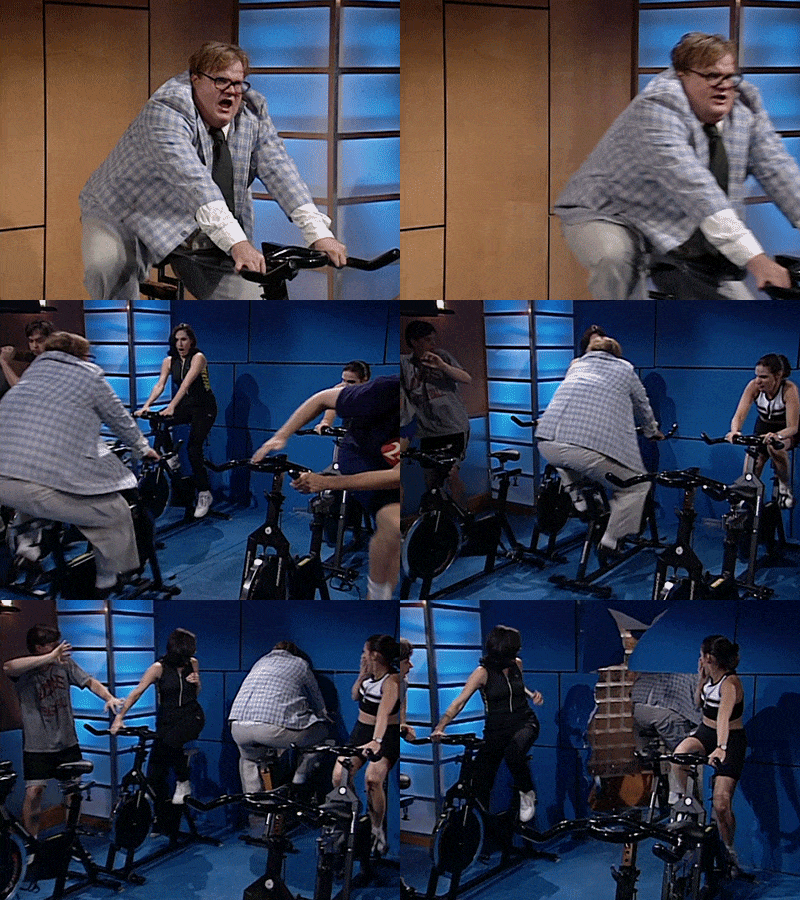
The only thing you can possibly gather from Sasquatch's real chart is that masks may have made it worse.

 Page 11 of 11


Popular
Back to top
 Follow TigerDroppings for LSU Football News