- My Forums
- Tiger Rant
- LSU Recruiting
- SEC Rant
- Saints Talk
- Pelicans Talk
- More Sports Board
- Fantasy Sports
- Golf Board
- Soccer Board
- O-T Lounge
- Tech Board
- Home/Garden Board
- Outdoor Board
- Health/Fitness Board
- Movie/TV Board
- Book Board
- Music Board
- Political Talk
- Money Talk
- Fark Board
- Gaming Board
- Travel Board
- Food/Drink Board
- Ticket Exchange
- TD Help Board
Customize My Forums- View All Forums
- Show Left Links
- Topic Sort Options
- Trending Topics
- Recent Topics
- Active Topics
Started By
Message
Weather Map Interpretation
Posted on 1/21/26 at 12:54 pm
Posted on 1/21/26 at 12:54 pm
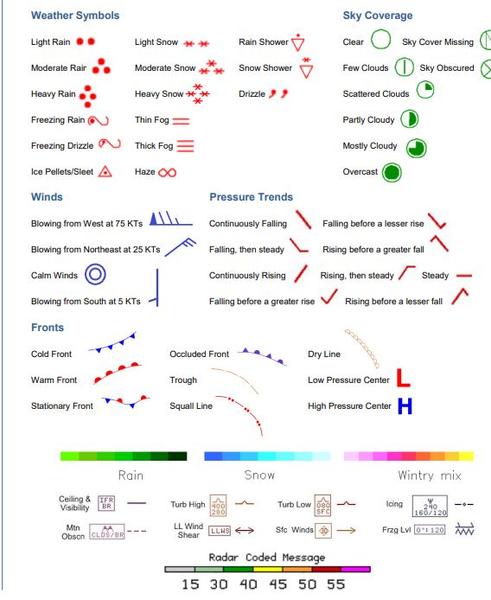
Can anyone provide suggestions on how to interpret the colorful and technical weather maps people post when severe weather is predicted, including the letter/number designations? Any websites? AI helpful? Thanks
 10
10

Posted on 1/21/26 at 12:56 pm to gungho
within a storm cone means you are 68% chance of safe.

Posted on 1/21/26 at 12:56 pm to forkedintheroad
Blue=snow

Posted on 1/21/26 at 1:07 pm to gungho

Posted on 1/21/26 at 1:10 pm to gungho
Trust=peej
Dont trust=rds
Dont trust=rds

Posted on 1/21/26 at 1:12 pm to gungho
quote:
Can anyone provide suggestions on how to interpret the colorful and technical weather maps


Posted on 1/21/26 at 1:12 pm to gungho
Posted on 1/21/26 at 2:41 pm to gungho
Posted on 1/21/26 at 2:59 pm to gungho
I still can't wrap my head around why a Low Pressure system is labeled with a RED L and a High Pressure system is marked with a BLUE H.
Red should be Hot
Blue should be Cold!
Red should be Hot
Blue should be Cold!

Posted on 1/21/26 at 3:01 pm to gungho
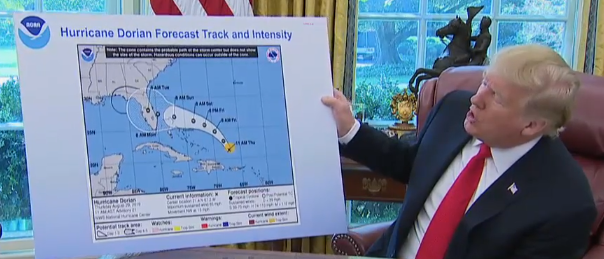
Trump University has a good course.
Posted on 1/21/26 at 3:07 pm to I20goon
That's a good chart for all the normal, basic stuff. What dicks everything are the proprietary products all the various outlets use and the brightly colored, arrow-filled images brought to us by the YouTube and Facebook "meteorologists".
This post was edited on 1/21/26 at 3:08 pm

Posted on 1/21/26 at 4:41 pm to LegendInMyMind
Respect the polygon.
Posted on 1/21/26 at 4:42 pm to alphaandomega
quote:You made Spann proud with that
Respect the polygon.
Posted on 1/21/26 at 7:49 pm to gungho

 Page 1 of 1


Popular
Back to top