




 1
1






- My Forums
- Tiger Rant
- LSU Recruiting
- SEC Rant
- Saints Talk
- Pelicans Talk
- More Sports Board
- Fantasy Sports
- Golf Board
- Soccer Board
- O-T Lounge
- Tech Board
- Home/Garden Board
- Outdoor Board
- Health/Fitness Board
- Movie/TV Board
- Book Board
- Music Board
- Political Talk
- Money Talk
- Fark Board
- Gaming Board
- Travel Board
- Food/Drink Board
- Ticket Exchange
- TD Help Board
Customize My Forums- View All Forums
- Show Left Links
- Topic Sort Options
- Trending Topics
- Recent Topics
- Active Topics
Started By
Message
re: Daily COVID Updated as of 11/2/20 8:00 PM
Posted on 5/13/20 at 8:19 am to Chromdome35
Posted on 5/13/20 at 8:19 am to Chromdome35

Saw this on twitter so take with a grain of salt, but is this accurate? If so the whole discussion of closing schools is just political pandering
Posted on 5/13/20 at 9:42 am to RebelExpress38
What is that supposed to represent? Total deaths? These seem to line up fairly closely with the data from ADPH for our state. Of our 428 total deaths, 12 are in the under 50 category, with all 12 of those having underlying conditions. In other words, if you are a relatively healthy person under the age of 50 in Alabama, you have a better chance of being killed by lightning than COVID-19.
Posted on 5/13/20 at 10:08 am to diddlydawg7
quote:
Ok, that one was pretty good
Nah I’ve always been you’re just finally coming around
Posted on 5/13/20 at 1:52 pm to Chromdome35
This is the link to the US state-level tracker that I have shared via Google Drive. Chromdome's State Level COVID-19 Daily Tracker
This is the link to the COVID-19 Country tracker that I have shared on Google Drive. Chromdome's COVID-19 Daily Tracker
The source for the data is https://www.worldometers.info/coronavirus/
The source for the testing data is from https://covidtracking.com/data/

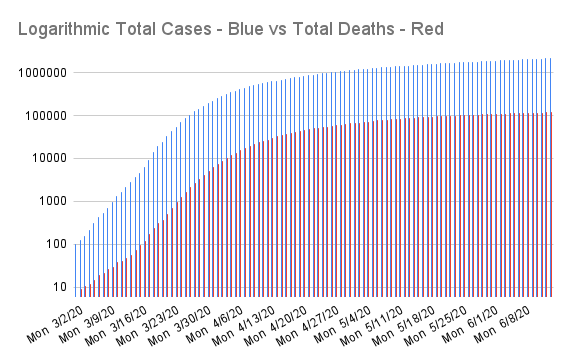


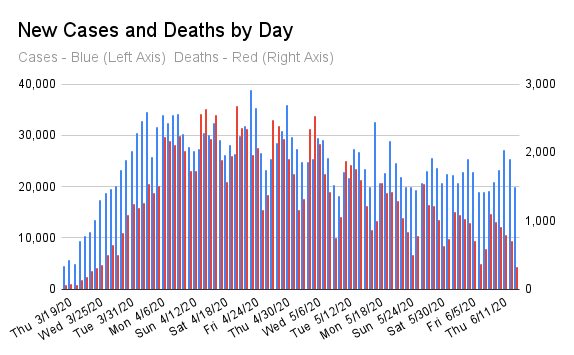
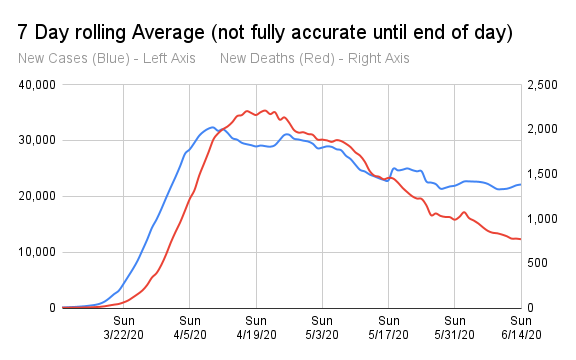
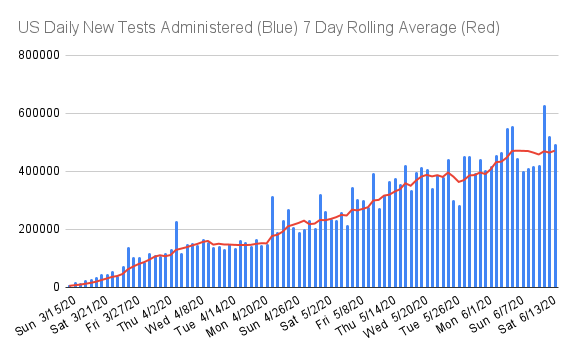

This is the link to the COVID-19 Country tracker that I have shared on Google Drive. Chromdome's COVID-19 Daily Tracker
The source for the data is https://www.worldometers.info/coronavirus/
The source for the testing data is from https://covidtracking.com/data/
Posted on 5/13/20 at 2:41 pm to Chromdome35
LINK
Blowing Up the Coronavirus: New Research Aims to Remove COVID-19 from Big Indoor Areas with Diesel Engines
Blowing Up the Coronavirus: New Research Aims to Remove COVID-19 from Big Indoor Areas with Diesel Engines
This post was edited on 5/13/20 at 2:43 pm
Posted on 5/13/20 at 5:59 pm to Route 66
The shorthorns will frick it up

Posted on 5/13/20 at 7:58 pm to BamaPig
If my math serves me right, new cases down around 3700 from last Wednesday, deaths down over 800 from last Wednesday.
Posted on 5/13/20 at 8:38 pm to Volsfan82169
That reduction in new cases is more impressive when you consider that there were 94,000 more tests given today than last Wednesday.
Posted on 5/13/20 at 8:58 pm to Chromdome35
This is the link to the US state-level tracker that I have shared via Google Drive. Chromdome's State Level COVID-19 Daily Tracker
This is the link to the COVID-19 Country tracker that I have shared on Google Drive. Chromdome's COVID-19 Daily Tracker
The source for the data is https://www.worldometers.info/coronavirus/
The source for the testing data is from https://covidtracking.com/data/

This is the link to the COVID-19 Country tracker that I have shared on Google Drive. Chromdome's COVID-19 Daily Tracker
The source for the data is https://www.worldometers.info/coronavirus/
The source for the testing data is from https://covidtracking.com/data/
Posted on 5/13/20 at 9:12 pm to Chromdome35
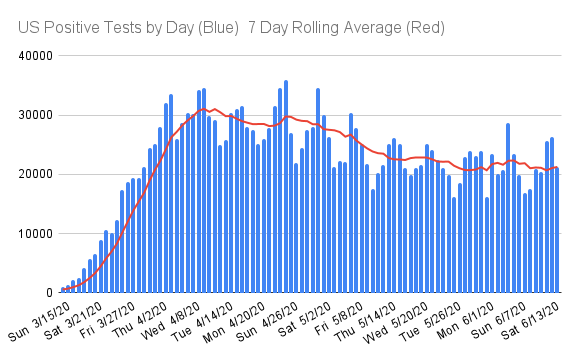
New cases down 1K from yesterday and 3.7K ~14.7% from last Wednesday. This is more impressive when you consider that testing was 103K higher ~48% this week than last.
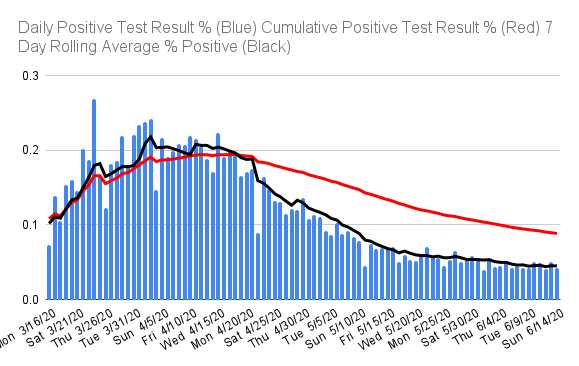
Lets talk about testing, Last Wednesday we had 215K tests with 22K positives for a postive% of 10.3%. This week we had 319K tests with 21.5K positives for a rate of 6.8% Testing #'s improved by 48% but the number of positive results fell. I think we're seeing much broader testing and the % of positive results is falling which leads me to the question of how many people do we think are actually infected?
Deaths were up over yesterday which is a bit of a surprise; however, the same pattern occurred last week. Deaths are down by 756 from last Wednesday a 30% decline.
Mortality rose .04% to 5.96%. This number needs to start coming down.
On the 7 Day rolling average graph, the downward trend is accelerating for deaths and flattening slightly for new cases.
Lets talk about testing, Last Wednesday we had 215K tests with 22K positives for a postive% of 10.3%. This week we had 319K tests with 21.5K positives for a rate of 6.8% Testing #'s improved by 48% but the number of positive results fell. I think we're seeing much broader testing and the % of positive results is falling which leads me to the question of how many people do we think are actually infected?
Deaths were up over yesterday which is a bit of a surprise; however, the same pattern occurred last week. Deaths are down by 756 from last Wednesday a 30% decline.
Mortality rose .04% to 5.96%. This number needs to start coming down.
On the 7 Day rolling average graph, the downward trend is accelerating for deaths and flattening slightly for new cases.
Posted on 5/13/20 at 9:42 pm to Chromdome35
quote:
Deaths were up over yesterday which is a bit of a surprise; however, the same pattern occurred last week. Deaths are down by 756 from last Wednesday a 30% decline.
This is would be interesting to dig into.
What days before had the highs for new cases?
Were these weekends? Were these holidays? What states/cities had the highest new cases on these days? Is it an operation/infrastructure issue? In those cities, how close were they to maxing out their capacity?
Alas, I'm too lazy to search for the answers.
*Edit: It looks like deaths increase majority of mondays and tuesdays since the start date. 82% of Mondays and Tuesdays since March 1st have an increase in deaths.
**Edit2: Ok. So if we start on wednesdays and go back one week, each week, peak cases occur most frequently on Fridays (at least in April, otherwise on Wednesdays in March).
AIGHT so tying my analysis together: majority of peak cases get reported late in the week, and then deaths go UP early in the following week.
My intuition posits that this is likely an infrastructure issue. Do I want to go deeper? Yes. Will I? My laziness posits that I probably will not.
This post was edited on 5/13/20 at 10:33 pm
Posted on 5/13/20 at 9:45 pm to Chromdome35
quote:I think last week was a result of New York dumping 500 of those previously unreported 1,500 (don’t know where the remaining 1,000 are) nursing home deaths. That puts the decline at about 13% which is in line with the overall trend.
Deaths were up over yesterday which is a bit of a surprise; however, the same pattern occurred last week. Deaths are down by 756 from last Wednesday a 30% decline.
It also looks like Pennsylvania and Massachusetts bucks the trend seen pretty much everywhere else, and they have a big jump on Wednesday’s instead of Tuesday.
This post was edited on 5/13/20 at 9:48 pm
Posted on 5/14/20 at 2:25 pm to Chromdome35
New cases and deaths look to be at lowest levels since end of March/first of April. Despite testing being 3x higher.
Does this mean we are past the peak?
Does this mean we are past the peak?
Posted on 5/14/20 at 2:57 pm to Jinglebob
We’ve been past the peak for a few weeks.
Posted on 5/14/20 at 4:10 pm to the808bass
J. Bel: We know laws don't apply to you Pols but shouldn't you be wearing a mask if we Provincials are all in jeopardy of getting the Red Chinese Virus!!!!!!!!!!!!!!!
Posted on 5/14/20 at 5:56 pm to Sundance
My hospital is at 93% ventilator capacity. We are about to have to make decisions
Posted on 5/14/20 at 6:01 pm to Tiguar
I assume your ICU census is up significantly from 6 weeks ago?
Posted on 5/14/20 at 6:06 pm to Tiguar
What city you in?
Posted on 5/14/20 at 6:26 pm to roadGator
Collin county checking in. 15 new cases and 23 total recovered for the day. First time I have seen recovered > new cases. Hospitalized is 18 down from 20, not due to death.
Our numbers are trending on right direction. Frisco, Plano, McKinney.
Our numbers are trending on right direction. Frisco, Plano, McKinney.
Posted on 5/14/20 at 6:44 pm to the808bass
Yes

 Page 215 of 331



Popular

Back to top
 Follow TigerDroppings for LSU Football News