




 4
4








- My Forums
- Tiger Rant
- LSU Recruiting
- SEC Rant
- Saints Talk
- Pelicans Talk
- More Sports Board
- Fantasy Sports
- Golf Board
- Soccer Board
- O-T Lounge
- Tech Board
- Home/Garden Board
- Outdoor Board
- Health/Fitness Board
- Movie/TV Board
- Book Board
- Music Board
- Political Talk
- Money Talk
- Fark Board
- Gaming Board
- Travel Board
- Food/Drink Board
- Ticket Exchange
- TD Help Board
Customize My Forums- View All Forums
- Show Left Links
- Topic Sort Options
- Trending Topics
- Recent Topics
- Active Topics
Started By
Message
Posted on 5/3/20 at 8:46 am to jeffsdad
Curious as to why? To me you want it from date of testing.
Posted on 5/3/20 at 8:49 am to jeffsdad
Government workers can’t handle that.
It would probably be difficult for sites like Worldometers to adjust for as well.
It would be more accurate. But it’s something we should just figure is baked in and look at big pictures. We’re getting more real-time data than probably any virus in history.
It would probably be difficult for sites like Worldometers to adjust for as well.
It would be more accurate. But it’s something we should just figure is baked in and look at big pictures. We’re getting more real-time data than probably any virus in history.
Posted on 5/3/20 at 8:55 am to jeffsdad
Cause you have labs that stack up testing and wait till they get a certain volume, or they may be just behind. So they end up waiting 7 days and test. Then they report it by testing date. You report by collection date and you get an answer that you can say....this patient had covid on this date and this patient did not. You can't say anything like that with reporting by testing date. In short, it skews the numbers of the dates people were sick with covid.
Posted on 5/3/20 at 8:57 am to the808bass
True, they probably can't. And its too late now. But every lab computer system I've worked with you have to put in the date and time of collection. Its simply a different capture.
Maybe next time thy will adjust at the beginning.
Maybe next time thy will adjust at the beginning.
Posted on 5/3/20 at 9:08 am to jeffsdad
quote:
No man, you want the test reported for the date of collection, not the date of testing. I have no idea what they are actually doing, seems like a mix.
Sorry. By test date I meant collection date. I edited. And I agree. Rather see how we're plotting it here vs when all the results come back.
Posted on 5/3/20 at 1:14 pm to SDVTiger
quote:This is not the thread for this. If you think it's a "lie", explain how or tell me the truth.
Can you just stop lying
Posted on 5/3/20 at 5:25 pm to Korkstand
quote:
This is not the thread for this. If you think it's a "lie", explain how or tell me the truth.
This is definitely not a thread for you to troll as you do every other thread, I agree.
Posted on 5/3/20 at 9:07 pm to Chromdome35
This is the link to the US state-level tracker that I have shared via Google Drive. Chromdome's State Level COVID-19 Daily Tracker
This is the link to the COVID-19 Country tracker that I have shared on Google Drive. Chromdome's COVID-19 Daily Tracker
The source for the data is https://www.worldometers.info/coronavirus/
The source for the testing data is from https://covidtracking.com/data/

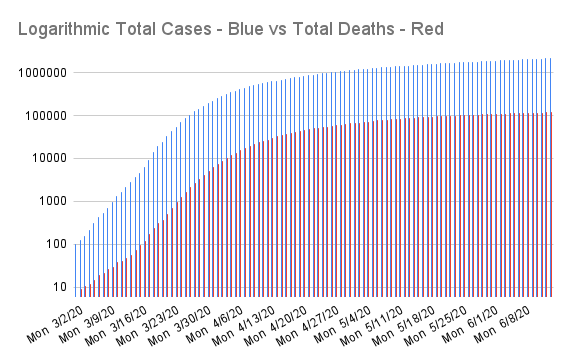


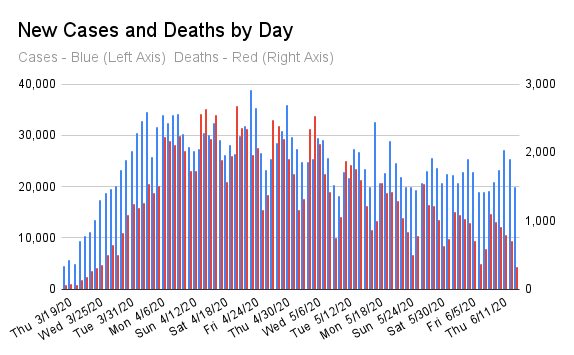
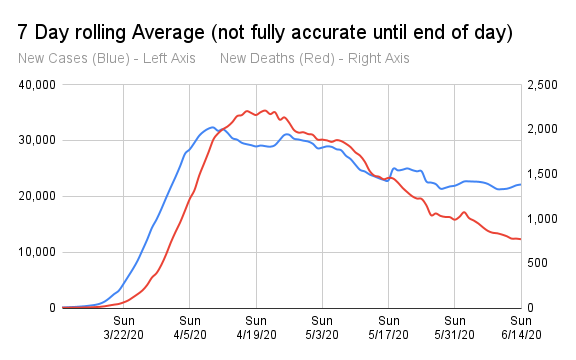
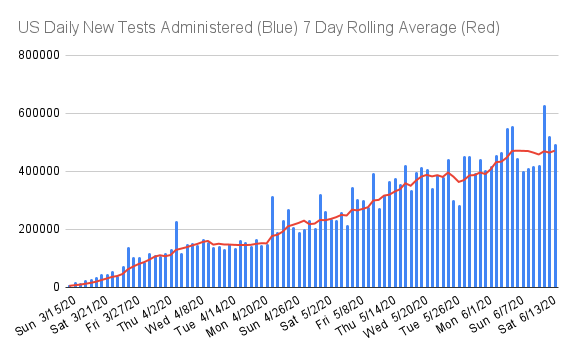
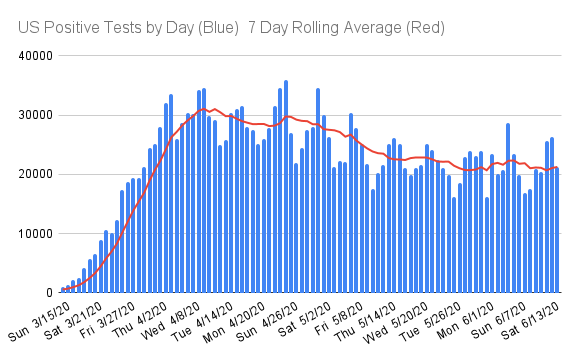
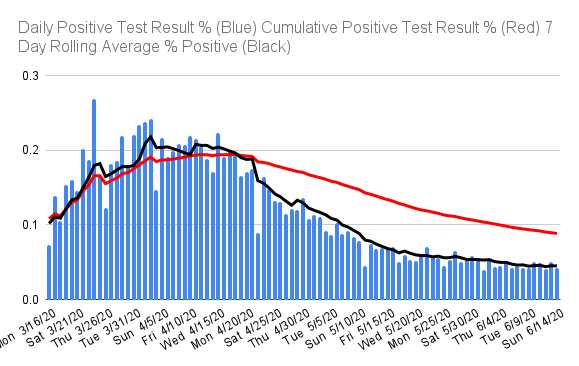

This is the link to the COVID-19 Country tracker that I have shared on Google Drive. Chromdome's COVID-19 Daily Tracker
The source for the data is https://www.worldometers.info/coronavirus/
The source for the testing data is from https://covidtracking.com/data/
Posted on 5/3/20 at 9:09 pm to Chromdome35
It was a normal Sunday...Good testing numbers though and Mortality fell a little.
Posted on 5/3/20 at 9:20 pm to Chromdome35
Thanks again for the hard work Chrome...it is appreciated.

Posted on 5/4/20 at 4:22 am to DMAN1968
You morons are still trying to figure out fake numbers? Lol guess what shite won’t add up. It’s been entertaining watching y’all rationalize this and that. 2,000 people die from the shits in the US every year don’t forget to put those down as China flu ?? 

Posted on 5/4/20 at 10:54 am to Chromdome35
LINK
The pre-pub paper link is LINK
This would help resolve the serological studies and rapid decline in cases in hotspots before herd immunity was been expected.
quote:
Individual variation in susceptibility or exposure to SARS-CoV-2 lowers the herd immunity threshold - this is a very clear and elegant demonstration of the possibility of herd-immunity to SARS2 being higher than generally accepted in many regions.
The pre-pub paper link is LINK
This would help resolve the serological studies and rapid decline in cases in hotspots before herd immunity was been expected.
Posted on 5/4/20 at 11:54 am to Taxing Authority
I'm sorry to have to ask for clarification but can I get some?? Thanks.
Posted on 5/4/20 at 12:57 pm to tiger91
quote:People that don't get infected due to natural resistance are every bit as good as people that get immunity being infected (or innoculated) for the purpose of herd immunity.
I'm sorry to have to ask for clarification but can I get some?? Thanks.
We know (probably) from the cruise ship that some people are exposed, but never get infected. No idea why. Doesn't really matter. But those people will never show up in the case counts nor serological studies, but... the virus will not propagate through those people--just like if they acquired immunity from active infection.
So if... there are a significant number of unsuseptable folks, we will reach herd immunity before we have a the 60-70% of people infected.
Kinda common sense, but easy to forget how important this is.
Posted on 5/4/20 at 5:02 pm to Taxing Authority
IHME model update 4-May
A ton of blame casting on other country's data, and a bunch of methodology changes...
A ton of blame casting on other country's data, and a bunch of methodology changes...
quote:Ridiculuous. They couldn't resolve their simpler model with observations. I don't think this will do any better.
Today we launch a major update to our COVID-19 estimation framework: a multi-stage hybrid model. This modeling approach involves estimating COVID-19 deaths and infections, as well as viral transmission, in multiple stages. It leverages a hybrid modeling approach through its statistical component (deaths model), a new component quantifying the rates at which individuals move from being susceptible to exposed, then infected, and then recovered (known as SEIR), and the existing microsimulation component that estimates hospitalizations. We have built this modeling platform to allow for regular data updates and to be flexible enough to incorporate new types of covariates as they become available. Last, by relating transmission parameters to predictions of key drivers of COVID-19 epidemic trends – temperature, the percentage of populations living in dense areas, testing per capita, and human mobility – this new modeling approach will allow for a more comprehensive examination of how COVID-19’s toll could unfold in the coming months, taking into account these underlying drivers.
quote:Wishcasting at it's finest.
This is particularly important as many locations ease or end prior distancing policies without having a clear sense of how these actions could potentially affect COVID-19 trajectories given current trends in testing and mobility, among others. With our new modeling framework, we aim to provide a venue through which different COVID-19 epidemic scenarios and responses can be explored by location.
Posted on 5/4/20 at 8:15 pm to Taxing Authority
I know it’s Monday and some of this is just Monday data. But it looks good to see new cases lowish and deaths low.
Third lowest percent of positive tests.
Third lowest percent of positive tests.
Posted on 5/4/20 at 8:21 pm to the808bass
Yep, it’s encouraging. If we can just have a Tuesday that isn’t the huge jumps we’ve been seeing I’ll be a lot more optimistic. Obviously it’ll be higher, but a smaller bump would be good to see.
Check out Spain and Italy recently for more good news. Huge drops there recently.
Check out Spain and Italy recently for more good news. Huge drops there recently.
This post was edited on 5/4/20 at 8:22 pm
Posted on 5/4/20 at 8:24 pm to ValDawgsta
It’s 70 days and down. That’s it.
Posted on 5/4/20 at 9:47 pm to Taxing Authority
quote:I’ve been critical of the model due to the misspecification of the parameters and the underlying distribution assumptions.
A ton of blame casting on other country's data, and a bunch of methodology changes...
That being said, the director of IHME was interviewed on the 538 podcast a couple of weeks ago and was very open about the flaws in the model (e.g., not symmetrical, skewed) and that it was underestimating deaths moving forward. In addition, I think some of their general ideas were sound (deaths were the least unreliable so they started there) as well as there initial assumptions that were later shown wrong as a function of human behavior (e.g., hospitalizations paradoxically decrease per death as they approach their peak).
And given how much criticism they get, from both sides of the argument, as well as flat out misrepresentations (e.g., people incorrectly attribute the 2 million and 240 thousand death predictions to them) I can at least respect that they’ve put themselves out there and have continued.
Regardless, it appears that this update is much more aligned with reality and it’s much closer to this other model I’ve been following that has seems pretty reliable and accurate.
AI COVID Projections
By the way, did you see Kevin Hassett (WH economic advisor, who infamously predicted the Dow was heading to 36,000 right before the Dotcom crash) pushed back against some of the projections and said his “cubic” model (apparently just went into excel and clicked the polynomial graph) is predicting we’ll be at about 0 deaths per day by May 15th.

 Page 204 of 331



Popular

Back to top
 Follow TigerDroppings for LSU Football News