




 1
1








- My Forums
- Tiger Rant
- LSU Recruiting
- SEC Rant
- Saints Talk
- Pelicans Talk
- More Sports Board
- Fantasy Sports
- Golf Board
- Soccer Board
- O-T Lounge
- Tech Board
- Home/Garden Board
- Outdoor Board
- Health/Fitness Board
- Movie/TV Board
- Book Board
- Music Board
- Political Talk
- Money Talk
- Fark Board
- Gaming Board
- Travel Board
- Food/Drink Board
- Ticket Exchange
- TD Help Board
Customize My Forums- View All Forums
- Show Left Links
- Topic Sort Options
- Trending Topics
- Recent Topics
- Active Topics
Started By
Message
re: Daily COVID Updated as of 11/2/20 8:00 PM
Posted on 5/1/20 at 8:17 pm to Chromdome35
Posted on 5/1/20 at 8:17 pm to Chromdome35
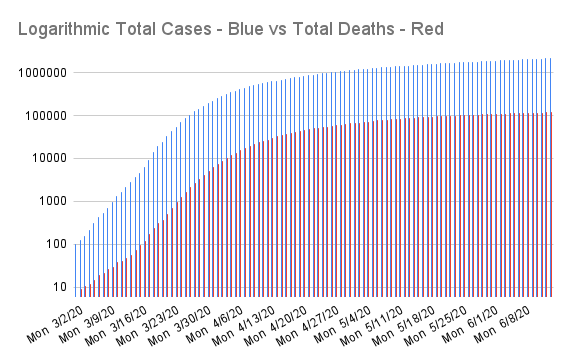
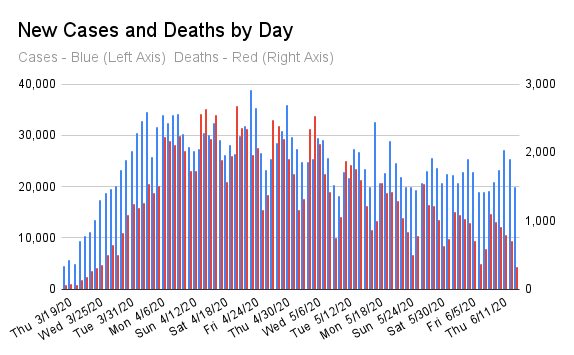
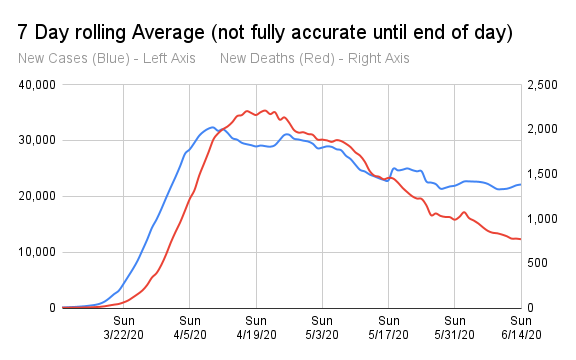
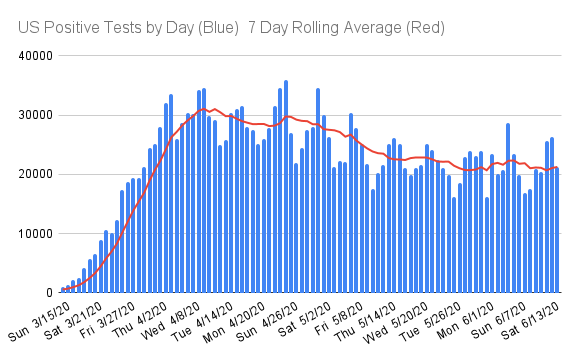
New Cases today rose to 36K, the highest number since last Friday. The 7 day rolling average is still showing downward movement, but that won't last long if the numbers keep going up.
Deaths are down by 304 from yesterday and the 7 day rolling average is slowing declining. Deaths fell for the 4th day in a row.
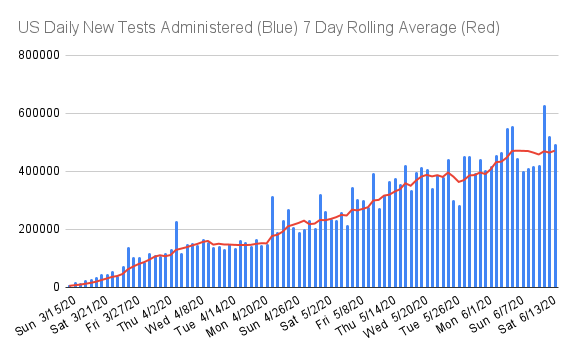
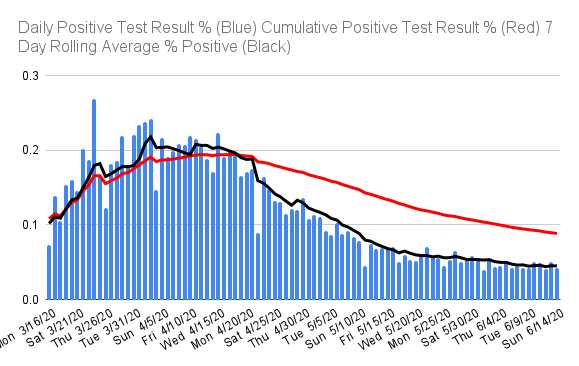
Testing saw the largest number to date at 320K tests, of those 34.5K were positive for a daily rate of 10.8% which is significantly lower than the cumulative average of 16.7%.
Mortality fell .02%.
The 7 day rolling average graph really shows well the very slow decline in the numbers.
Deaths are down by 304 from yesterday and the 7 day rolling average is slowing declining. Deaths fell for the 4th day in a row.
Testing saw the largest number to date at 320K tests, of those 34.5K were positive for a daily rate of 10.8% which is significantly lower than the cumulative average of 16.7%.
Mortality fell .02%.
The 7 day rolling average graph really shows well the very slow decline in the numbers.
Posted on 5/1/20 at 8:21 pm to Chromdome35
I do think you were right early on. Our testing was constraining the number of positives more than symptomatic cases were.
I also think that Covid bed utilization is trending down in probably 90% or higher of the country.
We may have a continual drumbeat of 1,000 lives lost/day for some time until it’s just too hard for the virus to find new victims that are susceptible and compromised enough in some way to damage.
I also think that Covid bed utilization is trending down in probably 90% or higher of the country.
We may have a continual drumbeat of 1,000 lives lost/day for some time until it’s just too hard for the virus to find new victims that are susceptible and compromised enough in some way to damage.
Posted on 5/1/20 at 8:37 pm to Chromdome35
Curious about CDC numbers. Another thread popped up listing CDC total US deaths as 37,308. OP linked source.
CDC stats ending 4/25
Am I missing something obvious? The figure here ending 4/25 is 54,256. Something's fricky.
CDC stats ending 4/25
Am I missing something obvious? The figure here ending 4/25 is 54,256. Something's fricky.
Posted on 5/1/20 at 8:38 pm to IslandBuckeye
There’s another category of pneumonia + Covid in that chart.
Posted on 5/1/20 at 8:40 pm to the808bass
Hopefully, Testing volume will continue to increase for both antibodies and infection. Testing really is the key we need to fill in some big missing pieces.
Posted on 5/1/20 at 9:10 pm to the808bass
The CDC number I listed above was covid only. That is the number that I was comparing to Chromedome figures.
Posted on 5/1/20 at 10:01 pm to IslandBuckeye
Buckeye, I think I might know why. WorldOMeter, COVID Tracking Project, and several other trackers seem to be listing the deaths as reported at the state level. The CDC numbers probably lag behind just due to bureaucratic friction.
The footnotes from that page would seem to indicate this could be the reason.
The footnotes from that page would seem to indicate this could be the reason.
quote:
NOTE: Number of deaths reported in this table are the total number of deaths received and coded as of the date of analysis and do not represent all deaths that occurred in that period. The United States population, based on 2018 postcensal estimates from the U.S. Census Bureau, is 327,167,434.
*Data during this period are incomplete because of the lag in time between when the death occurred and when the death certificate is completed, submitted to NCHS and processed for reporting purposes. This delay can range from 1 week to 8 weeks or more, depending on the jurisdiction, age, and cause of death.
This post was edited on 5/1/20 at 10:03 pm
Posted on 5/2/20 at 6:09 am to Chromdome35
Thanks for your thoughts. Looks like data sources harvested information using different criteria. Can this get more complicated.
To maintain consistency and my mental state, I will continue to roll with your numbers.
My question originated in watching the CFR. In my opinion it will have to start trending down some day. Maybe my confirmation bias is getting the better of me.

To maintain consistency and my mental state, I will continue to roll with your numbers.
My question originated in watching the CFR. In my opinion it will have to start trending down some day. Maybe my confirmation bias is getting the better of me.
Posted on 5/2/20 at 10:44 am to IslandBuckeye
Some states are counting three positive tests on one patient as three new cases.
If you break out the duplicates it is significant.
If you break out the duplicates it is significant.
Posted on 5/2/20 at 11:54 am to zeebo
Louisiana 5/2
429 "new" cases up to 29140
23 new deaths up to 1950
-62 hospitalizations down to 1545
-22 vents down to 208
And our governor STILL, I bet a drink, extend us when the current EO runs out. That said, my husband and I went to a local restaurant last night, had friends meet us and had a great dinner/good drinks and heard good music. Screw you JBE.
429 "new" cases up to 29140
23 new deaths up to 1950
-62 hospitalizations down to 1545
-22 vents down to 208
And our governor STILL, I bet a drink, extend us when the current EO runs out. That said, my husband and I went to a local restaurant last night, had friends meet us and had a great dinner/good drinks and heard good music. Screw you JBE.
Posted on 5/2/20 at 1:40 pm to Chromdome35
This is the link to the US state-level tracker that I have shared via Google Drive. Chromdome's State Level COVID-19 Daily Tracker
This is the link to the COVID-19 Country tracker that I have shared on Google Drive. Chromdome's COVID-19 Daily Tracker
The source for the data is https://www.worldometers.info/coronavirus/
The source for the testing data is from https://covidtracking.com/data/




This is the link to the COVID-19 Country tracker that I have shared on Google Drive. Chromdome's COVID-19 Daily Tracker
The source for the data is https://www.worldometers.info/coronavirus/
The source for the testing data is from https://covidtracking.com/data/
Posted on 5/2/20 at 3:11 pm to Chromdome35
New confirmed cases has been on a gradual decline since the first week of April. By the time the summer is over the cases will be much fewer but I don't expect it to hit zero.
By the time football season comes around society will have moved on from Covid and onto something else.
Obviously some dumb worry warts will remain at home but more power to them.
By the time football season comes around society will have moved on from Covid and onto something else.
Obviously some dumb worry warts will remain at home but more power to them.
Posted on 5/2/20 at 8:31 pm to Chromdome35
This is the link to the US state-level tracker that I have shared via Google Drive. Chromdome's State Level COVID-19 Daily Tracker
This is the link to the COVID-19 Country tracker that I have shared on Google Drive. Chromdome's COVID-19 Daily Tracker
The source for the data is https://www.worldometers.info/coronavirus/
The source for the testing data is from https://covidtracking.com/data/

This is the link to the COVID-19 Country tracker that I have shared on Google Drive. Chromdome's COVID-19 Daily Tracker
The source for the data is https://www.worldometers.info/coronavirus/
The source for the testing data is from https://covidtracking.com/data/
Posted on 5/2/20 at 8:38 pm to Chromdome35
I have a suggestion for your table. Since daily changes are meaningless because of the poor reporting on weekends, I have started comparing to the week before on the same day. That’s related to the 7 day rolling average but maybe a column that shows the difference in fatalities each day compared to 7 days prior?
It was a good day today. About 400 less fatalities than last Saturday.
It was a good day today. About 400 less fatalities than last Saturday.
Posted on 5/2/20 at 9:56 pm to lsumatt
BCS Guru

Posted on 5/2/20 at 10:34 pm to Jrv2damac
Maybe not the right place but y'all are the facts and figures group. We know that the flu is tracked and, I assume, it is tracked in the same way that covid is tracked.
Does anyone have any numbers on the flu and a comparison with covid? What I mean is that if the flu numbers trended down while the covid numbers went up, that would seem to show a bias toward the covid diagnosis. Given isolation, both numbers and deaths should trend down, right?
Does anyone have any numbers on the flu and a comparison with covid? What I mean is that if the flu numbers trended down while the covid numbers went up, that would seem to show a bias toward the covid diagnosis. Given isolation, both numbers and deaths should trend down, right?
Posted on 5/3/20 at 3:11 am to dafif
quote:It is not. Flu is mostly not paid much attention. Sometimes flu is mentioned on death certs, but most times it is not. Only about 20-30% of flu deaths actually mention flu on the death cert. Many more mention pneumonia. The CDC estimates yearly flu figures based on "excess deaths" over what was expected without flu. These figures are not finalized for years, and even then the range of uncertainty is large.
We know that the flu is tracked and, I assume, it is tracked in the same way that covid is tracked.
Covid, being novel, is paid much closer attention. Records are kept more closely. The probable cases are recorded immediately rather than waiting 2 years after the fact to add them in as we do with flu.
quote:The best source of data on flu that I've found is here. You can see how many total deaths are recorded by week, with pneumonia and flu broken out. Keep in mind, it can take 8 weeks or more for death certs to be received and processed, so the few most recent weeks will continue to rise as data is received. There is not a covid column on that sheet, but the most interesting thing to me is watching the pneumonia cases track up and down with flu. Up until April of this year, that is. Weekly pneumonia deaths are far exceeding anything in the data as far back as I've been able to find, and they are increasing as flu cases are decreasing. That is not typical, as you can see.
Does anyone have any numbers on the flu and a comparison with covid?
quote:No. You have to remember that covid started at zero only a few months ago, whereas flu had a "running start" of millions of cases carried over from last year. This could very well be the time of year that covid would trend down along with flu, but we can't know for sure because it wouldn't have had a good hold yet during peak season.
What I mean is that if the flu numbers trended down while the covid numbers went up, that would seem to show a bias toward the covid diagnosis. Given isolation, both numbers and deaths should trend down, right?
Posted on 5/3/20 at 8:14 am to Korkstand
quote:
Covid, being novel, is paid much closer attention. Records are kept more closely. The probable cases are recorded immediately rather than waiting 2 years after the fact to add them in as we do with flu.
Can you just stop lying
Posted on 5/3/20 at 8:21 am to Chromdome35
Are these final for yesterday?
Posted on 5/3/20 at 8:21 am to SDVTiger
I do like how Tarrant county is also showing positives based on collection date. I wish more places would do this. It's still looking like it's taking a while to get results back. Several positives from yesterday were collected 12 days ago.
05/01/20

05/02/20

05/01/20
05/02/20
This post was edited on 5/3/20 at 12:02 pm

 Page 203 of 331



Popular

Back to top
 Follow TigerDroppings for LSU Football News