




 2
2














- My Forums
- Tiger Rant
- LSU Recruiting
- SEC Rant
- Saints Talk
- Pelicans Talk
- More Sports Board
- Fantasy Sports
- Golf Board
- Soccer Board
- O-T Lounge
- Tech Board
- Home/Garden Board
- Outdoor Board
- Health/Fitness Board
- Movie/TV Board
- Book Board
- Music Board
- Political Talk
- Money Talk
- Fark Board
- Gaming Board
- Travel Board
- Food/Drink Board
- Ticket Exchange
- TD Help Board
Customize My Forums- View All Forums
- Show Left Links
- Topic Sort Options
- Trending Topics
- Recent Topics
- Active Topics
Started By
Message
re: Daily COVID Updated as of 11/2/20 8:00 PM
Posted on 4/30/20 at 7:45 pm to Chromdome35
Posted on 4/30/20 at 7:45 pm to Chromdome35
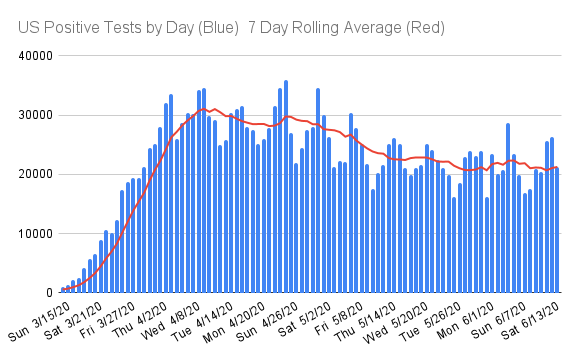
There is a 4 day upward trend on new cases, The 7 day rolling average cases is still showing a slow downward trend.
Deaths are down by 188 from yesterday and the 7 day average is still showing a slow downward trend.
Mortality is swinging upwards again
Testing was at 205K today, it looks like the low 200k's is the new normal daily testing rate for the time being.
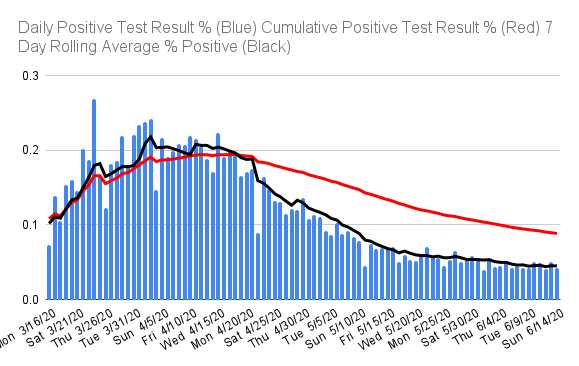
There were 27.9K positive cases today for a 13.6% rate. That's up 1.6% from yesterday but the cumulative % positive rate is still falling.
Deaths are down by 188 from yesterday and the 7 day average is still showing a slow downward trend.
Mortality is swinging upwards again
Testing was at 205K today, it looks like the low 200k's is the new normal daily testing rate for the time being.
There were 27.9K positive cases today for a 13.6% rate. That's up 1.6% from yesterday but the cumulative % positive rate is still falling.
Posted on 4/30/20 at 7:59 pm to Chromdome35
quote:Sorry I didn’t respond earlier. First of all, you’re doing an awesome job, so I don’t think you SHOULD add any graphs.
Hey Buckeye, are there any graphs I should add?
If there was anything to add. the only thing I could think of is a graph that overlays the moving average of cases and tests, since as you’ve noted, despite cases remaining flat (or even a slight uptick) the percentage of positive continue to trend downward. This indicates something more positive than the cases themselves would show.
But that’s just my opinion of course.
Posted on 4/30/20 at 8:27 pm to Chromdome35
quote:
I think we'll hit at least 100K deaths and could see more depending on the length of the tail
I'm curious what flu deaths will look like next season. You'd think there would be a reduction because available frail persons died of COVID.
This post was edited on 4/30/20 at 8:28 pm
Posted on 4/30/20 at 9:14 pm to Chromdome35
Yeah, we're 3 days, give or take from 70k deaths, and 8 to 9 from 80k. Even with continued downward pressure on the death rate, 110k isn't out of the question by the end of May.
I think 100k is probably too low of an estimate now, particularly through the end of September. Probably closer to 150k now, sad to say.
I think 100k is probably too low of an estimate now, particularly through the end of September. Probably closer to 150k now, sad to say.
Posted on 4/30/20 at 9:25 pm to Ace Midnight
Unless it just tails off to nothing very quickly, I think you’re right. And there’s no indication that a sudden drop will happen.
Posted on 4/30/20 at 10:07 pm to Teddy Ruxpin
quote:
I'm curious what flu deaths will look like next season. You'd think there would be a reduction because available frail persons died of COVID.
Sorry if this has already been asked. What is the net increase in deaths for this period YOY? We now know (will know) Covid deaths+ any other deaths for the past 2 months. How does that compare to March-April 2019? I think that would be worthy of review. Also, not sure if obtainable, average age of decedent. That gives us a look at potential "human life years" lost.
Posted on 4/30/20 at 10:16 pm to Oenophile Brah
quote:
Also, not sure if obtainable, average age of decedent. That gives us a look at potential "human life years" lost.
This wouldn’t be impossible, but it’s not going to turn out like most people think. A person who makes it to 65 has, on average over 18 years left. A person at 75 has over 11 years left on average.
Posted on 4/30/20 at 10:40 pm to the808bass
quote:
This wouldn’t be impossible, but it’s not going to turn out like most people think. A person who makes it to 65 has, on average over 18 years left. A person at 75 has over 11 years left on average.
I understand obtaining the data may be impossible, but it isn't useless. Comparing the average age of decedent in the period of March - April 2019 v 2020 gives us a look at net human life years lost. Perhaps, more lives were lost in 2020, but if the average age of decedent is 10+ years higher, the "Human life years" lost could be different. Thus, worthy of review.
This post was edited on 4/30/20 at 10:42 pm
Posted on 4/30/20 at 10:47 pm to Oenophile Brah
If mortality is drastically higher (which it undoubtedly will be), years of life lost will be higher by a factor.
Posted on 4/30/20 at 11:09 pm to the808bass
quote:
If mortality is drastically higher (which it undoubtedly will be), years of life lost will be higher by a factor.
While that could be true, we know this virus has most harshly affected the elderly with pre-existing health conditions. That sub-set of elderly would not have the same life expectancy as the "average" 65 or 75 year old would receive. While possibly not calculable, that would reduce the expected human life years lost for 2020. If properly understood and described to the public, this would offer a different calculus for how we perceive the threat of the virus.
This post was edited on 4/30/20 at 11:10 pm
Posted on 4/30/20 at 11:36 pm to buckeye_vol
Thanks Buckeye.
This is the 7 day rolling average new cases vs 7 day rolling average positive tests

This is the same thing except it is vs total tests.

This is the 7 day rolling average new cases vs 7 day rolling average positive tests
This is the same thing except it is vs total tests.
Posted on 5/1/20 at 3:38 am to Oenophile Brah
quote:
While that could be true, we know this virus has most harshly affected the elderly with pre-existing health conditions. That sub-set of elderly would not have the same life expectancy as the "average" 65 or 75 year old would receive.
Many average 65-75 year olds have pre-existing conditions. For example, 63% of people over 65 have hypertension.
Posted on 5/1/20 at 3:54 am to the808bass
quote:
Many average 65-75 year olds have pre-existing conditions. For example, 63% of people over 65 have hypertension.
Not surprising but an interesting metric to know
Posted on 5/1/20 at 9:26 am to Powerman
what are everyone's thoughts on that Rt website gumbopot posted?
LINK
looking at the graphs, NY and LA were already on a sharp-slope down before the shelter orders were placed. It didn't seem to appreciably change those slopes. On first glance, it looks like those orders did absolutely nothing in those states.
LINK
looking at the graphs, NY and LA were already on a sharp-slope down before the shelter orders were placed. It didn't seem to appreciably change those slopes. On first glance, it looks like those orders did absolutely nothing in those states.
Posted on 5/1/20 at 10:41 am to Tiguar
I think it is very interesting, I don't understand enough about their methodology to know if its valid or not.
The first question that comes into mind when looking at this is the quality of the data solid enough from the early stages to be able to accurately portray the Rt value at that time? Maybe someone who knows more about this can chime in.
The first question that comes into mind when looking at this is the quality of the data solid enough from the early stages to be able to accurately portray the Rt value at that time? Maybe someone who knows more about this can chime in.
Posted on 5/1/20 at 10:42 am to Tiguar
Yeah. That jibes with the WSJ piece that showed no difference.
Posted on 5/1/20 at 4:14 pm to the808bass
This is a little too tin foil hat in my book, but I wonder how long it takes State to update their dashboards. There's been a lot of news in DFW this week about the 17 year old that died of Covid-19 last Saturday. Still no one in her age group (10-19 years old) shown to have died in Texas from covid.
LINK
LINK
LINK
LINK
Posted on 5/1/20 at 7:15 pm to nerd guy
I'm really questioning the quarantine strategy at this point.
If everyone has been quarantined and cases are still not going down then it's pointless.
Unfortunately the governor's won't see it and we are fricked.
If everyone has been quarantined and cases are still not going down then it's pointless.
Unfortunately the governor's won't see it and we are fricked.
Posted on 5/1/20 at 7:45 pm to Chromdome35
Just wanted to thank you for the work you've done here. Really appreciate it.
Posted on 5/1/20 at 8:12 pm to Chromdome35
This is the link to the US state-level tracker that I have shared via Google Drive. Chromdome's State Level COVID-19 Daily Tracker
This is the link to the COVID-19 Country tracker that I have shared on Google Drive. Chromdome's COVID-19 Daily Tracker
The source for the data is https://www.worldometers.info/coronavirus/
The source for the testing data is from https://covidtracking.com/data/

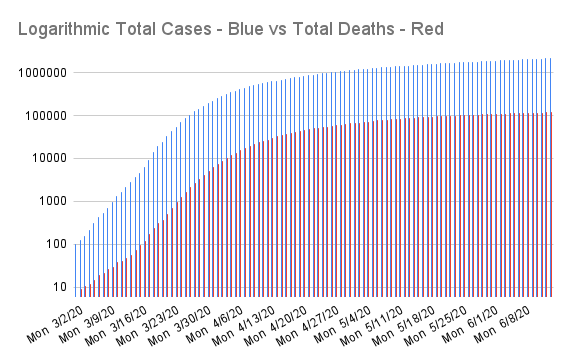


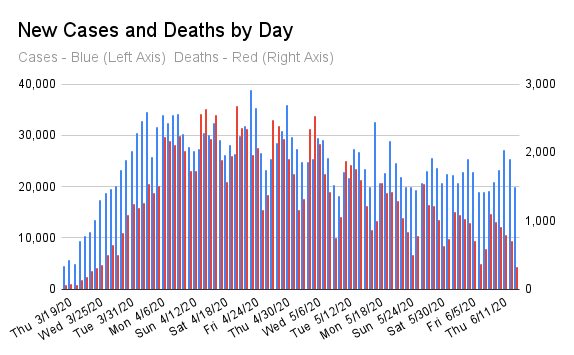
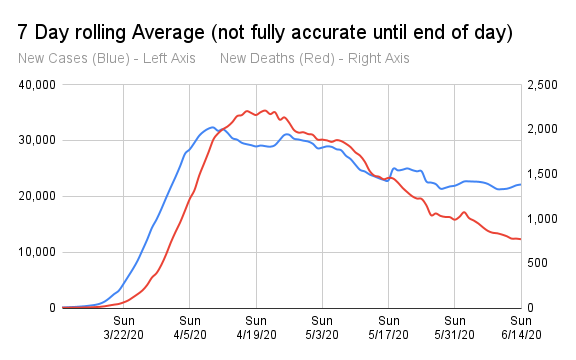
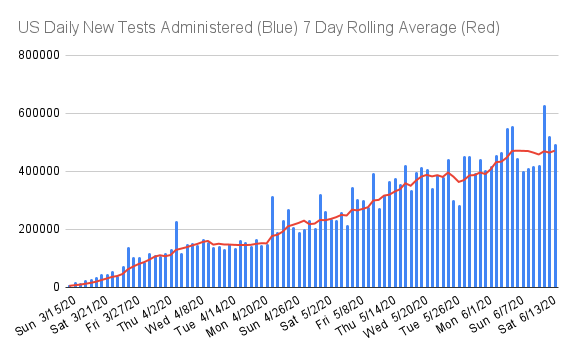

This is the link to the COVID-19 Country tracker that I have shared on Google Drive. Chromdome's COVID-19 Daily Tracker
The source for the data is https://www.worldometers.info/coronavirus/
The source for the testing data is from https://covidtracking.com/data/

 Page 202 of 331



Popular

Back to top
 Follow TigerDroppings for LSU Football News