




 0
0











- My Forums
- Tiger Rant
- LSU Recruiting
- SEC Rant
- Saints Talk
- Pelicans Talk
- More Sports Board
- Fantasy Sports
- Golf Board
- Soccer Board
- O-T Lounge
- Tech Board
- Home/Garden Board
- Outdoor Board
- Health/Fitness Board
- Movie/TV Board
- Book Board
- Music Board
- Political Talk
- Money Talk
- Fark Board
- Gaming Board
- Travel Board
- Food/Drink Board
- Ticket Exchange
- TD Help Board
Customize My Forums- View All Forums
- Show Left Links
- Topic Sort Options
- Trending Topics
- Recent Topics
- Active Topics
Started By
Message
re: Daily COVID Updated as of 11/2/20 8:00 PM
Posted on 4/25/20 at 11:02 am to dafif
Posted on 4/25/20 at 11:02 am to dafif
quote:
So far, this entire episode is frustrating
Further frustrations for me was trying to determine if the curve can be "shrunk". This is the cry from the left: not only can we flatten the curve, we can shrink it.
With reproductive number (r0, or Rt) seemingly higher, a lot of people will ultimately be infected. Hence, I do not believe we can "shrink" the curve. When I search for the science on this, the only proponents are left biased.
The next important number, CFR appears to me to be inaccurate at this point. I suspect it will be lower than currently stated at 4-5%. Dramatically lower.
Therefore, I do not subscribe to extending shut down. Protect those at risk, okey dokey.
Posted on 4/25/20 at 5:28 pm to Chromdome35
This is the link to the US state level tracker that I have shared via Google Drive. Chromdome's State Level COVID-19 Daily Tracker
This is the link to the COVID-19 Country tracker that I have shared on Google Drive. Chromdome's COVID-19 Daily Tracker
The source for the data is https://www.worldometers.info/coronavirus/
The source for the testing data is from https://covidtracking.com/data/
4/18/20 UPDATE: I am changing these updates to show the data for the US without NY State numbers included. The information and graphs presented in my updates going forward will all be from the perspective of omitting NY State results. All of the original data is still present on the tracker linked above


This is the link to the COVID-19 Country tracker that I have shared on Google Drive. Chromdome's COVID-19 Daily Tracker
The source for the data is https://www.worldometers.info/coronavirus/
The source for the testing data is from https://covidtracking.com/data/
4/18/20 UPDATE: I am changing these updates to show the data for the US without NY State numbers included. The information and graphs presented in my updates going forward will all be from the perspective of omitting NY State results. All of the original data is still present on the tracker linked above
Posted on 4/25/20 at 5:32 pm to Chromdome35
Wow, big numbers on the weekend. Tuesday is going to really suck this week I guess.
Of course we know more test = more positives but still would like to see a reduction as a result of the quarantine.
Of course we know more test = more positives but still would like to see a reduction as a result of the quarantine.
Posted on 4/25/20 at 6:51 pm to Chromdome35
Would you consider changing the color coding rules for percentage increase in number of tests given? An increase in percentage there should be green since more testing is a good thing.
Posted on 4/25/20 at 8:02 pm to tgrgrd00
quote:
Wow, big numbers on the weekend. Tuesday is going to really suck this week I guess.
Yeah. I was hoping with the heat we’d see a dramatic fall in cases in April like we do with the flu, but I guess that’s not happening.
Posted on 4/25/20 at 8:23 pm to TeLeFaWx
quote:
I was hoping with the heat we’d see a dramatic fall in cases in April
Well, it’s still pretty cold on a lot of places. I feel the same way about all these bullshite measures that were put in place. Weird how steady the growth rate in cases has been, though.
This post was edited on 4/25/20 at 8:25 pm
Posted on 4/25/20 at 8:41 pm to TigerFanatic99
Good catch, done.
Posted on 4/25/20 at 8:45 pm to Chromdome35
This is the link to the US state level tracker that I have shared via Google Drive. Chromdome's State Level COVID-19 Daily Tracker
This is the link to the COVID-19 Country tracker that I have shared on Google Drive. Chromdome's COVID-19 Daily Tracker
The source for the data is https://www.worldometers.info/coronavirus/
The source for the testing data is from https://covidtracking.com/data/
4/18/20 UPDATE: I am changing these updates to show the data for the US without NY State numbers included. The information and graphs presented in my updates going forward will all be from the perspective of omitting NY State results. All of the original data is still present on the tracker linked above

This is the link to the COVID-19 Country tracker that I have shared on Google Drive. Chromdome's COVID-19 Daily Tracker
The source for the data is https://www.worldometers.info/coronavirus/
The source for the testing data is from https://covidtracking.com/data/
4/18/20 UPDATE: I am changing these updates to show the data for the US without NY State numbers included. The information and graphs presented in my updates going forward will all be from the perspective of omitting NY State results. All of the original data is still present on the tracker linked above
Posted on 4/25/20 at 8:58 pm to Chromdome35
I am considering going back to publishing US overall numbers instead of US less NY. The recent restatement of the NY numbers on the WoM site are causing problems for the US without NY data.
Cases returned to their normal levels today while the rate of new deaths fell again forming a 5 day downward trend.
Daily testing appears to have a new normal at around 300K tests per day. At this volume, the % positive rate is declining with it falling to 11.9% for today's tests outside of NY.
Looking at the seven day rolling average deaths, you can see that it has leveled off and is showing a downward tendency.
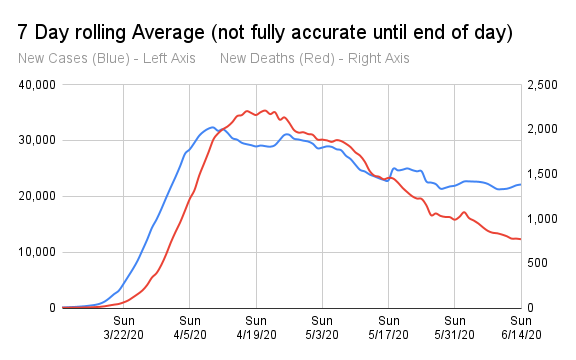
Cases returned to their normal levels today while the rate of new deaths fell again forming a 5 day downward trend.
Daily testing appears to have a new normal at around 300K tests per day. At this volume, the % positive rate is declining with it falling to 11.9% for today's tests outside of NY.
Looking at the seven day rolling average deaths, you can see that it has leveled off and is showing a downward tendency.
This post was edited on 4/25/20 at 9:07 pm
Posted on 4/25/20 at 10:59 pm to Chromdome35
quote:
Chromdome35
Nice work man

Posted on 4/25/20 at 11:02 pm to Chromdome35
quote:
I am considering going back to publishing US overall numbers instead of US less NY
please and thanks
Posted on 4/26/20 at 2:07 am to Chromdome35
quote:
Looking at the seven day rolling average deaths, you can see that it has leveled off and is showing a downward tendency.
Forgive me if this is somewhere in this thread already, but have states been publishing their number of active hospitalizations from COVID-19 relative to the number of available beds in each state?
I can't find this info for Georgia. Just number of hospitalizations, and it doesn't specify whether that's active or cumulative (although I'm thinking the latter).
Posted on 4/26/20 at 7:12 am to TerryDawg03
Terry, the IHME model has that info in it. Google IHME model and it should take you right to it. You can change the state by manipulating the drop down at the top of the IHME page.
Posted on 4/26/20 at 7:27 am to Chromdome35
Positive tests: 649,555
Cases: 672,338
Difference: 22,783
I’m intrigued.
What scenario would you add a positive case without a positive test and not confirm with a positive test?
Cases: 672,338
Difference: 22,783
I’m intrigued.
What scenario would you add a positive case without a positive test and not confirm with a positive test?
This post was edited on 4/26/20 at 7:48 am
Posted on 4/26/20 at 7:47 am to the808bass
We are likely reaching the point where newly positive cases is not being driven as much by symptomatic cases.
Missouri is recording positive tests of 150-200/day even as hospital utilization steadily goes down. This is even though our previous peak of newly positive cases per day was 250 on April 6th, 19 days ago. So while new cases are now bouncing around around 175/day, hospital utilization has fallen by 20%ish during those 19 days (A peak around 1100 hospitalizations down to 850 as of yesterday). And the state has not had a day in which current hospitalizations has increased in that time frame.
I suspect this is being driven in part by the gating guidelines.
Missouri is recording positive tests of 150-200/day even as hospital utilization steadily goes down. This is even though our previous peak of newly positive cases per day was 250 on April 6th, 19 days ago. So while new cases are now bouncing around around 175/day, hospital utilization has fallen by 20%ish during those 19 days (A peak around 1100 hospitalizations down to 850 as of yesterday). And the state has not had a day in which current hospitalizations has increased in that time frame.
I suspect this is being driven in part by the gating guidelines.
Posted on 4/26/20 at 7:49 am to Chromdome35
IHME appears to have given up tracking current hospitalizations versus projected hospitalizations. I don’t know if finding the data was hard across the board (different states seem to have varying levels of opacity on this stat) or if it was just too disconnected from their projections.
Posted on 4/26/20 at 8:39 am to the808bass
quote:
What scenario would you add a positive case without a positive test and not confirm with a positive test?
I think the reporting of cases and positive tests aren’t simultaneous across the board. The positive test may have been reported the day before the positive case. If the next day is low on positive tests, this could lead to more reported cases than positive tests that day.
There could be something else at play as well. Just speculating based on the figures we have.
Posted on 4/26/20 at 8:41 am to Chromdome35
quote:
I am considering going back to publishing US overall numbers instead of US less NY. The recent restatement of the NY numbers on the WoM site are causing problems for the US without NY data.
Yeah. I would do it. I think we’re all pretty attuned to the fact that New York isn’t figuring its way out of this.
Posted on 4/26/20 at 8:53 am to the808bass
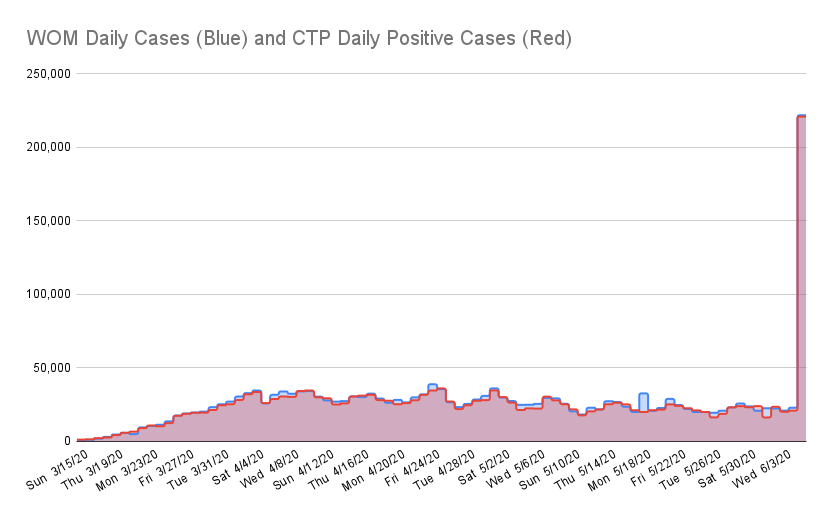
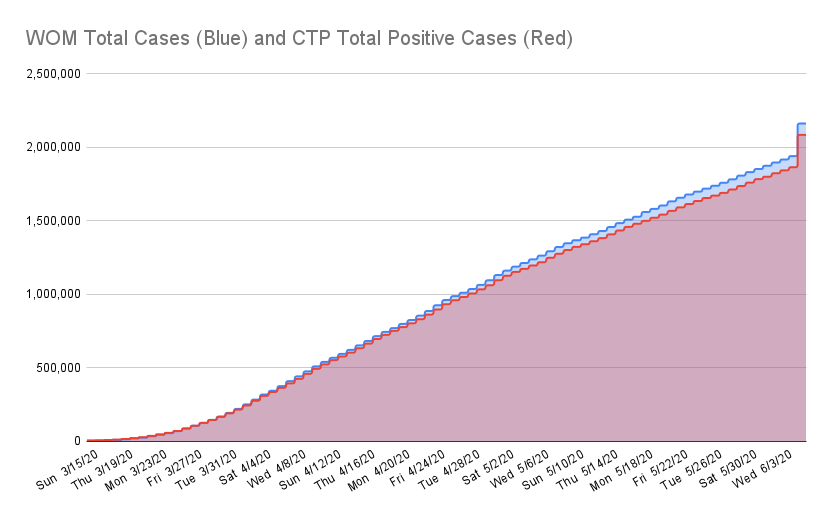
I added a new tab to show the variance between WOM and CTP. It's the very last tab in the tracker.
The WoM Numbers have never lined up exactly to the COVID Tracking Project (CTP) Site Numbers. The CTP site is the only place that solid testing numbers are published. The WoM numbers include corrections after the fact such as what happened with the additional cases/deaths added after the CDC guideline revision. The CTP site doesn't appear to present revised data.
WOM shows 29K more cases and 6.2K more deaths than the CTP.
And for Deaths
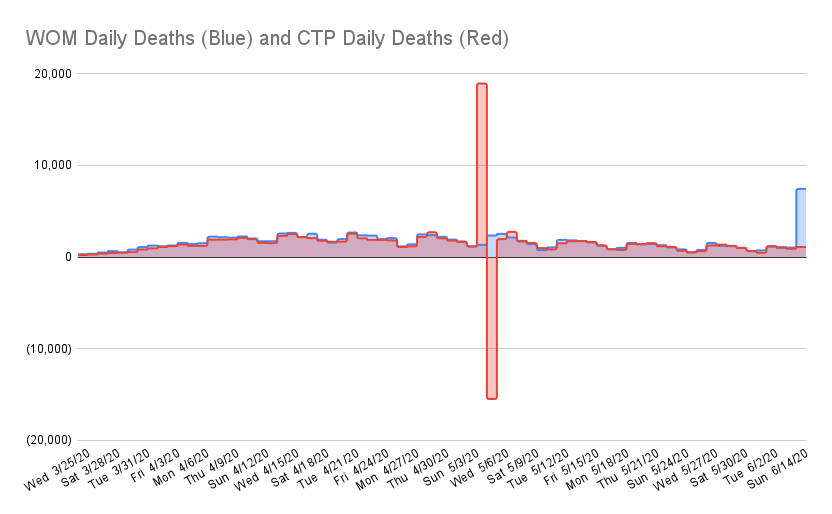
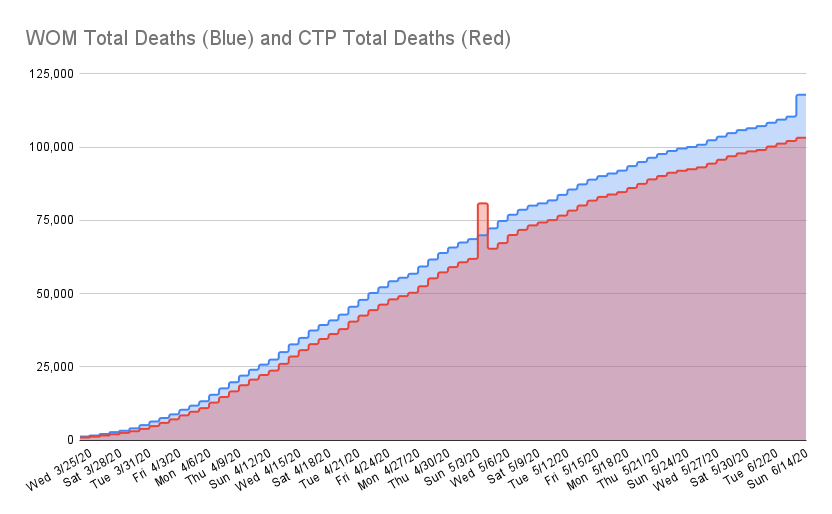
The WoM Numbers have never lined up exactly to the COVID Tracking Project (CTP) Site Numbers. The CTP site is the only place that solid testing numbers are published. The WoM numbers include corrections after the fact such as what happened with the additional cases/deaths added after the CDC guideline revision. The CTP site doesn't appear to present revised data.
WOM shows 29K more cases and 6.2K more deaths than the CTP.
And for Deaths
This post was edited on 4/26/20 at 9:00 am
Posted on 4/26/20 at 9:06 am to the808bass
Considering they didn’t just shut down the site after predicting 300k deaths, they probably just can’t get that info reliably.

 Page 196 of 331



Popular

Back to top
 Follow TigerDroppings for LSU Football News