




 1
1










- My Forums
- Tiger Rant
- LSU Score Board
- LSU Recruiting
- SEC Rant
- SEC Score Board
- Saints Talk
- Pelicans Talk
- More Sports Board
- Fantasy Sports
- Golf Board
- Soccer Board
- O-T Lounge
- Tech Board
- Home/Garden Board
- Outdoor Board
- Health/Fitness Board
- Movie/TV Board
- Book Board
- Music Board
- Political Talk
- Money Talk
- Fark Board
- Gaming Board
- Travel Board
- Food/Drink Board
- Ticket Exchange
- TD Help Board
Customize My Forums- View All Forums
- Show Left Links
- Topic Sort Options
- Trending Topics
- Recent Topics
- Active Topics
Started By
Message
re: Daily COVID Updated as of 11/2/20 8:00 PM
Posted on 4/14/20 at 8:10 am to imjustafatkid
Posted on 4/14/20 at 8:10 am to imjustafatkid
quote:
Usually Mondays have higher numbers than Saturday and Sunday.
Last week, it was actually Tuesday that had the spike, although it ended up being very consistent with Thursday and Friday.
Just the average number being down is encouraging for the peak having already passed.
Posted on 4/14/20 at 9:04 am to Chromdome35
This is the link to the US state level tracker that I have shared via Google Drive. Chromdome's State Level COVID-19 Daily Tracker
This is the link to the COVID-19 Country tracker that I have shared on Google Drive. Chromdome's COVID-19 Daily Tracker
On the state level tracker the states I have available right now are listed below. I will be adding additional states in the coming days.
Arkansas, Louisiana, New York, Georgia, Florida, California
The source for the data is https://www.worldometers.info/coronavirus/
The source for the testing data is from https://covidtracking.com/data/
On the tracker sheet you will see tabs for the following data:
1) US Summary
2) Country Comparables: This shows you how the US stacks up vs. select other countries dealing with COVID-19
3) Logarithmic Comparisons - Shows the US vs the other countries on the tracker.
4) Covid Vs Other Outbreaks - Compares the current COVID numbers to the last 10 years of flue and H1N1
5) US Weighted Averages - Explores 7 day vs 3 day weight average trends
6) Italy Summary
7) UK Summary
8) France Summary
9) Germany Summary
10) Sweden Summary
11) World Summary
NOTE: The daily growth rate data will not be accurate until the end of the day's postings. It will change throughout the day.
NOTE: I am not tracking individual states, I don't have a reliable consistent source for that data.
NOTE: I am not a mathematician, statistics guru, scientist, sharpest tack in the box, I'm just a guy who likes to understand for myself what is happening and to share it with others. This thread was not created to debate if you should or shouldn't take this seriously, it is simply to present the numbers and foster conversation.
NOTE: I have added a prediction number to the bottom of the data grid. This simply takes the previous days numbers and grows them at the previous day's growth rate. It should give the viewer some idea of what the numbers will look like today. Obviously, the final number for the day will be higher or lower based on what today's growth rate actualy is. This is just a simple indicator.




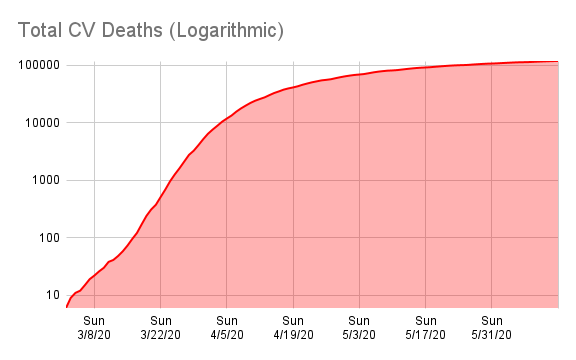


This is the link to the COVID-19 Country tracker that I have shared on Google Drive. Chromdome's COVID-19 Daily Tracker
On the state level tracker the states I have available right now are listed below. I will be adding additional states in the coming days.
Arkansas, Louisiana, New York, Georgia, Florida, California
The source for the data is https://www.worldometers.info/coronavirus/
The source for the testing data is from https://covidtracking.com/data/
On the tracker sheet you will see tabs for the following data:
1) US Summary
2) Country Comparables: This shows you how the US stacks up vs. select other countries dealing with COVID-19
3) Logarithmic Comparisons - Shows the US vs the other countries on the tracker.
4) Covid Vs Other Outbreaks - Compares the current COVID numbers to the last 10 years of flue and H1N1
5) US Weighted Averages - Explores 7 day vs 3 day weight average trends
6) Italy Summary
7) UK Summary
8) France Summary
9) Germany Summary
10) Sweden Summary
11) World Summary
NOTE: The daily growth rate data will not be accurate until the end of the day's postings. It will change throughout the day.
NOTE: I am not tracking individual states, I don't have a reliable consistent source for that data.
NOTE: I am not a mathematician, statistics guru, scientist, sharpest tack in the box, I'm just a guy who likes to understand for myself what is happening and to share it with others. This thread was not created to debate if you should or shouldn't take this seriously, it is simply to present the numbers and foster conversation.
NOTE: I have added a prediction number to the bottom of the data grid. This simply takes the previous days numbers and grows them at the previous day's growth rate. It should give the viewer some idea of what the numbers will look like today. Obviously, the final number for the day will be higher or lower based on what today's growth rate actualy is. This is just a simple indicator.
Posted on 4/14/20 at 9:52 am to Chromdome35
These trends seem to be readily apparent at this point. We'd need to see a significant number of deaths today to not be at an inflection point.
Posted on 4/14/20 at 10:41 am to TeLeFaWx
Another strong drop in Spain. Fewest deaths since 3/21, fewest new cases since 3/17.
Posted on 4/14/20 at 10:44 am to ValDawgsta
quote:
Another strong drop in Spain. Fewest deaths since 3/21, fewest new cases since 3/17.
I'm kind of new to this thread but shouldn't we wait until this afternoon to get a good idea if that is true or not? I know around noon the US numbers jump by the hundreds. Is that the same for the other countries?
Posted on 4/14/20 at 10:46 am to cdur86
I could be wrong on this, but I think their official numbers come out in the early evening each day. So around lunchtime on the east coast of the US.
Posted on 4/14/20 at 10:46 am to cdur86
theyre quite a few hours ahead of us.
Posted on 4/14/20 at 10:49 am to cdur86
I just refreshed it and it went from 100 to almost 900 for the US
Posted on 4/14/20 at 10:50 am to cdur86
The European countries typically do one major update in the mid-morning (US Time). For some of them, they don't update again, others like Germany will update multiple times a day.
Posted on 4/14/20 at 10:51 am to cdur86
New York reported a fairy hefty jump in deaths today
But remember, Tuesday is often the day when the weekend backlog is reported
But remember, Tuesday is often the day when the weekend backlog is reported
Posted on 4/14/20 at 11:22 am to Ace Midnight
If the hospitals aren't projected to be unable to provide caee for the projected patients, then none of these stats should weigh on the decision to reopen things.
Posted on 4/14/20 at 11:54 am to Tiguar
Louisiana death spike ... deaths from 884 yesterday to 1013 today.
Posted on 4/14/20 at 11:55 am to uway
Chrome,
Your U.S. mortality rate in the country comparison bar charts show ~ 2.5% instead of > 4%.
Posted on 4/14/20 at 12:07 pm to Chromdome35
I thought we’d peak at 2 CFR.
Then I thought we’d peak at 4.
When is that fricking number going to stop going up?
Then I thought we’d peak at 4.
When is that fricking number going to stop going up?
Posted on 4/14/20 at 12:10 pm to Nawlens Gator
Thanks for the catch Nawlens!
When I added the 7 day rolling average new cases column, I forgot to update the hard reference to the mortality cell, it was mistakenly pointing at the serious case %.
When I added the 7 day rolling average new cases column, I forgot to update the hard reference to the mortality cell, it was mistakenly pointing at the serious case %.
Posted on 4/14/20 at 12:11 pm to uway
quote:Things are still tight in several regions. In NJ 56% of all ventilators are in use right now. Considering that every major hospital should have a few free and there should be at least one free at every critical care center, that doesn't leave a lot. Luckily for NJ a good portion of the federal supply is staged at Fort Dix, right in the middle of NJ and not much more than 90 minutes from any part of the state.
If the hospitals aren't projected to be unable to provide caee for the projected patients, then none of these stats should weigh on the decision to reopen things.
Posted on 4/14/20 at 12:12 pm to mmcgrath
quote:
Things are still tight in several regions. In NJ 56% of all ventilators are in use right now. Considering that every major hospital should have a few free and there should be at least one free at every critical care center, that doesn't leave a lot.
Lol. That’s about the normal percentage of vents in use.
Posted on 4/14/20 at 12:16 pm to the808bass
quote:When start testing people not already infected and in the hospital in significant numbers.
When is that fricking number going to stop going up?

The problem we're going to start running into is that testing will be too late. A lot people that *had* COVID will test negative-even though they survived. That'll distort the CFR even more.
With multiple studies showing ~15% infection rate... the CFR should be waaay lower.
This post was edited on 4/14/20 at 12:19 pm
Posted on 4/14/20 at 12:20 pm to Taxing Authority
I hope one of the takeaways after this is all over is the need for a much tighter reporting protocol.
We have been hamstrung throughout this event by the lack of solid information. Even the numbers being generated now are still not consistently reliable, ie the weekend hangover or the reclassification of death numbers.
We have been hamstrung throughout this event by the lack of solid information. Even the numbers being generated now are still not consistently reliable, ie the weekend hangover or the reclassification of death numbers.
Posted on 4/14/20 at 12:21 pm to the808bass
50-60% vents isn’t scary average icu
average icu 
 Page 171 of 331



Popular

Back to top
 Follow TigerDroppings for LSU Football News