




 1
1






- My Forums
- Tiger Rant
- LSU Score Board
- LSU Recruiting
- SEC Rant
- SEC Score Board
- Saints Talk
- Pelicans Talk
- More Sports Board
- Fantasy Sports
- Golf Board
- Soccer Board
- O-T Lounge
- Tech Board
- Home/Garden Board
- Outdoor Board
- Health/Fitness Board
- Movie/TV Board
- Book Board
- Music Board
- Political Talk
- Money Talk
- Fark Board
- Gaming Board
- Travel Board
- Food/Drink Board
- Ticket Exchange
- TD Help Board
Customize My Forums- View All Forums
- Show Left Links
- Topic Sort Options
- Trending Topics
- Recent Topics
- Active Topics
Started By
Message
re: Daily COVID Updated as of 11/2/20 8:00 PM
Posted on 4/12/20 at 4:58 pm to Chromdome35
Posted on 4/12/20 at 4:58 pm to Chromdome35
This is the link to the US state level tracker that I have shared via Google Drive. Chromdome's State Level COVID-19 Daily Tracker
This is the link to the COVID-19 Country tracker that I have shared on Google Drive. Chromdome's COVID-19 Daily Tracker
On the state level tracker the states I have available right now are listed below. I will be adding additional states in the coming days.
Arkansas, Louisiana, New York, Georgia, Florida, California
The source for the data is https://www.worldometers.info/coronavirus/
The source for the testing data is from https://covidtracking.com/data/
On the tracker sheet you will see tabs for the following data:
1) US Summary
2) Country Comparables: This shows you how the US stacks up vs. select other countries dealing with COVID-19
3) Logarithmic Comparisons - Shows the US vs the other countries on the tracker.
4) Covid Vs Other Outbreaks - Compares the current COVID numbers to the last 10 years of flue and H1N1
5) US Weighted Averages - Explores 7 day vs 3 day weight average trends
6) Italy Summary
7) UK Summary
8) France Summary
9) Germany Summary
10) Sweden Summary
11) World Summary
NOTE: The daily growth rate data will not be accurate until the end of the day's postings. It will change throughout the day.
NOTE: I am not tracking individual states, I don't have a reliable consistent source for that data.
NOTE: I am not a mathematician, statistics guru, scientist, sharpest tack in the box, I'm just a guy who likes to understand for myself what is happening and to share it with others. This thread was not created to debate if you should or shouldn't take this seriously, it is simply to present the numbers and foster conversation.
NOTE: I have added a prediction number to the bottom of the data grid. This simply takes the previous days numbers and grows them at the previous day's growth rate. It should give the viewer some idea of what the numbers will look like today. Obviously, the final number for the day will be higher or lower based on what today's growth rate actualy is. This is just a simple indicator.




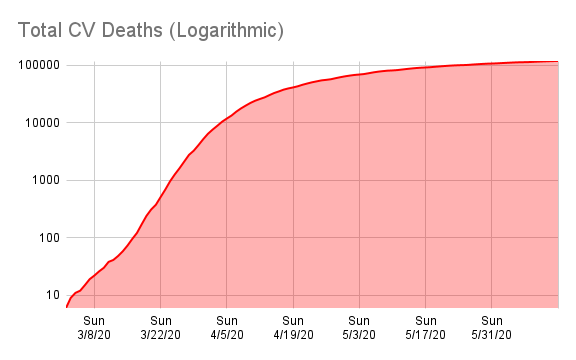


This is the link to the COVID-19 Country tracker that I have shared on Google Drive. Chromdome's COVID-19 Daily Tracker
On the state level tracker the states I have available right now are listed below. I will be adding additional states in the coming days.
Arkansas, Louisiana, New York, Georgia, Florida, California
The source for the data is https://www.worldometers.info/coronavirus/
The source for the testing data is from https://covidtracking.com/data/
On the tracker sheet you will see tabs for the following data:
1) US Summary
2) Country Comparables: This shows you how the US stacks up vs. select other countries dealing with COVID-19
3) Logarithmic Comparisons - Shows the US vs the other countries on the tracker.
4) Covid Vs Other Outbreaks - Compares the current COVID numbers to the last 10 years of flue and H1N1
5) US Weighted Averages - Explores 7 day vs 3 day weight average trends
6) Italy Summary
7) UK Summary
8) France Summary
9) Germany Summary
10) Sweden Summary
11) World Summary
NOTE: The daily growth rate data will not be accurate until the end of the day's postings. It will change throughout the day.
NOTE: I am not tracking individual states, I don't have a reliable consistent source for that data.
NOTE: I am not a mathematician, statistics guru, scientist, sharpest tack in the box, I'm just a guy who likes to understand for myself what is happening and to share it with others. This thread was not created to debate if you should or shouldn't take this seriously, it is simply to present the numbers and foster conversation.
NOTE: I have added a prediction number to the bottom of the data grid. This simply takes the previous days numbers and grows them at the previous day's growth rate. It should give the viewer some idea of what the numbers will look like today. Obviously, the final number for the day will be higher or lower based on what today's growth rate actualy is. This is just a simple indicator.
Posted on 4/12/20 at 5:13 pm to Chromdome35
Hope you are feeling better CD. 
Posted on 4/12/20 at 5:17 pm to mmcgrath
I'm doing fine, it really only hurts when I'm at the keyboard for too long. The damn cut is right where my left palm lays on the palm rest.
Posted on 4/12/20 at 6:48 pm to Chromdome35
Thank you for keeping this thread going, Chrom. I don't post here much but this has started to be my go-to link to get a quick look at how the numbers are looking. Much appreciated.
This post was edited on 4/12/20 at 6:51 pm
Posted on 4/12/20 at 6:54 pm to LSURussian
Have any of you other Louisiana folks watched Gov Edwards' daily press briefings (I refuse to watch him) and heard if he has mentioned anything about how he requested 14,000 ventilators from the Federal government about 10 days ago and the most number of ventilators Louisiana has had in use so far at one time is about 700?
I wish a reporter would ask him about that...
I wish a reporter would ask him about that...
Posted on 4/12/20 at 6:56 pm to LSURussian
Louisiana is 11 days behind Italy.
Posted on 4/12/20 at 7:32 pm to Microtiger
Thank you for your kind words.
Posted on 4/12/20 at 8:04 pm to Chromdome35
This is the link to the US state level tracker that I have shared via Google Drive. Chromdome's State Level COVID-19 Daily Tracker
This is the link to the COVID-19 Country tracker that I have shared on Google Drive. Chromdome's COVID-19 Daily Tracker
On the state level tracker the states I have available right now are listed below. I will be adding additional states in the coming days.
Arkansas, Louisiana, New York, Georgia, Florida, California
The source for the data is https://www.worldometers.info/coronavirus/
The source for the testing data is from https://covidtracking.com/data/
On the tracker sheet you will see tabs for the following data:
1) US Summary
2) Country Comparables: This shows you how the US stacks up vs. select other countries dealing with COVID-19
3) Logarithmic Comparisons - Shows the US vs the other countries on the tracker.
4) Covid Vs Other Outbreaks - Compares the current COVID numbers to the last 10 years of flue and H1N1
5) US Weighted Averages - Explores 7 day vs 3 day weight average trends
6) Italy Summary
7) UK Summary
8) France Summary
9) Germany Summary
10) Sweden Summary
11) World Summary
NOTE: The daily growth rate data will not be accurate until the end of the day's postings. It will change throughout the day.
NOTE: I am not tracking individual states, I don't have a reliable consistent source for that data.
NOTE: I am not a mathematician, statistics guru, scientist, sharpest tack in the box, I'm just a guy who likes to understand for myself what is happening and to share it with others. This thread was not created to debate if you should or shouldn't take this seriously, it is simply to present the numbers and foster conversation.
NOTE: I have added a prediction number to the bottom of the data grid. This simply takes the previous days numbers and grows them at the previous day's growth rate. It should give the viewer some idea of what the numbers will look like today. Obviously, the final number for the day will be higher or lower based on what today's growth rate actualy is. This is just a simple indicator.

This is the link to the COVID-19 Country tracker that I have shared on Google Drive. Chromdome's COVID-19 Daily Tracker
On the state level tracker the states I have available right now are listed below. I will be adding additional states in the coming days.
Arkansas, Louisiana, New York, Georgia, Florida, California
The source for the data is https://www.worldometers.info/coronavirus/
The source for the testing data is from https://covidtracking.com/data/
On the tracker sheet you will see tabs for the following data:
1) US Summary
2) Country Comparables: This shows you how the US stacks up vs. select other countries dealing with COVID-19
3) Logarithmic Comparisons - Shows the US vs the other countries on the tracker.
4) Covid Vs Other Outbreaks - Compares the current COVID numbers to the last 10 years of flue and H1N1
5) US Weighted Averages - Explores 7 day vs 3 day weight average trends
6) Italy Summary
7) UK Summary
8) France Summary
9) Germany Summary
10) Sweden Summary
11) World Summary
NOTE: The daily growth rate data will not be accurate until the end of the day's postings. It will change throughout the day.
NOTE: I am not tracking individual states, I don't have a reliable consistent source for that data.
NOTE: I am not a mathematician, statistics guru, scientist, sharpest tack in the box, I'm just a guy who likes to understand for myself what is happening and to share it with others. This thread was not created to debate if you should or shouldn't take this seriously, it is simply to present the numbers and foster conversation.
NOTE: I have added a prediction number to the bottom of the data grid. This simply takes the previous days numbers and grows them at the previous day's growth rate. It should give the viewer some idea of what the numbers will look like today. Obviously, the final number for the day will be higher or lower based on what today's growth rate actualy is. This is just a simple indicator.
Posted on 4/12/20 at 8:08 pm to Chromdome35
The number of new cases added per day has declined for 4 days in a row now. The daily number of new deaths has fallen for 3 days in a row.
That is excellent news. The rapidly declining numbers lend strength to the argument to reopen the economy.
Testing, 139K, ANOTHER day (6 out of 10 now) with testing numbers at the same level, this is more than a statistical anomaly.
That is excellent news. The rapidly declining numbers lend strength to the argument to reopen the economy.
Testing, 139K, ANOTHER day (6 out of 10 now) with testing numbers at the same level, this is more than a statistical anomaly.
Posted on 4/12/20 at 8:11 pm to Chromdome35
lowest deaths in 6 days
2nd lowest positive in last 11 days
Good news on Easter Sunday
2nd lowest positive in last 11 days
Good news on Easter Sunday
Posted on 4/12/20 at 8:44 pm to Chromdome35
Please be a good week
Last two have beaten me up
Last two have beaten me up
Posted on 4/12/20 at 9:04 pm to Jrv2damac
I have faith the worst is behind us as a country.
Some hotspots will rise and fall
Some hotspots will rise and fall
Posted on 4/12/20 at 9:05 pm to Jrv2damac
I'd call this weekend a success.
I said last week would be our pea and it appears to have been.
This weekend I wanted to see a slight trend down in new confirmed cases. We did!
This week I want to see things continue to level off but also see a couple of days that trend a bit lower than we saw last week. Thus, total number of confirmed cases lower this week than last week.
I said last week would be our pea and it appears to have been.
This weekend I wanted to see a slight trend down in new confirmed cases. We did!
This week I want to see things continue to level off but also see a couple of days that trend a bit lower than we saw last week. Thus, total number of confirmed cases lower this week than last week.
Posted on 4/12/20 at 9:37 pm to uppermidwestbama
MOre testing done than yesterday with fewer confirmed cases. All good news.

Posted on 4/12/20 at 9:52 pm to uppermidwestbama
The main thing with testing is making sure you have the ingredients to actually perform a lot of tests. That is what the labs and states need to make sure they have enough off as we open up the country so testing can be done and then isolate, trace, isolate.
Posted on 4/12/20 at 9:52 pm to Chromdome35
quote:
Testing, 139K, ANOTHER day (6 out of 10 now) with testing numbers at the same level, this is more than a statistical anomaly.
Is the tests # the amount of tests given that day or the amount of tests processed that day?
I know early on there was a lag time of a few days to a week to get results, but thought that number was shrinking, maybe to the point of zero lag with the newer test kits.
Anyone know?
Posted on 4/12/20 at 10:05 pm to Jinglebob
A few thoughts and points
First, The Easter numbers should be way down due to lack of testing.
Second, Florida really only the "New York" part..ie Dade, Broward and Palm Beach counties.
Third, girlfriend has mask and puts it on whenever we go into store (Dollar store today...actually wish I wore one in there) (Bike store yesterday...and, why is a retail bike store "essential" - Basically they shut down amusement and retail to kill Florida over spring break but everything else is open.
Fourth, my friend whose golf course got closed in Palm Beach is going with 12 friends over to Naples to play 36 holes and spend the night. I'm certainly missing something there. Logistics are perplexing and it just seems stupid to me.
First, The Easter numbers should be way down due to lack of testing.
Second, Florida really only the "New York" part..ie Dade, Broward and Palm Beach counties.
Third, girlfriend has mask and puts it on whenever we go into store (Dollar store today...actually wish I wore one in there) (Bike store yesterday...and, why is a retail bike store "essential" - Basically they shut down amusement and retail to kill Florida over spring break but everything else is open.
Fourth, my friend whose golf course got closed in Palm Beach is going with 12 friends over to Naples to play 36 holes and spend the night. I'm certainly missing something there. Logistics are perplexing and it just seems stupid to me.
Posted on 4/12/20 at 10:42 pm to Chromdome35
Lowest increase in total cases since 3/31. Crazy.
Posted on 4/12/20 at 11:25 pm to Chromdome35
quote:
The number of new cases added per day has declined for 4 days in a row now. The daily number of new deaths has fallen for 3 days in a row.
That is excellent news. The rapidly declining numbers lend strength to the argument to reopen the economy.
Testing, 139K, ANOTHER day (6 out of 10 now) with testing numbers at the same level, this is more than a statistical anomaly.
Plus what I like is the decline is taking place over mid-week days, as opposed to weekend days, which have been erratic over the past few weeks, and inclines seem to kick back in once the Mondays come back around. But through the meat of this past week things really seemed to start to level off.
Another week this week of more of the same, and I'll feel that we're finally getting a stranglehold on things.....
Posted on 4/13/20 at 12:15 am to ConwayGamecock
Well, the nursing home where I do consulting now has 5 positive cases and 27 (if I counted right) results pending. 4 of the positive cases were done at/near the same time as those pending, within a day of each other at the most. They tested everyone who was in and around the originally positive resident.
That said, I'm hoping that those are negative and just not noted in the emr yet-- I'm also hoping that the lab would have called with any positive results as opposed to just faxing over.
That said, I'm hoping that those are negative and just not noted in the emr yet-- I'm also hoping that the lab would have called with any positive results as opposed to just faxing over.
This post was edited on 4/13/20 at 8:26 am

 Page 166 of 331



Popular

Back to top
 Follow TigerDroppings for LSU Football News