




 2
2







- My Forums
- Tiger Rant
- LSU Score Board
- LSU Recruiting
- SEC Rant
- SEC Score Board
- Saints Talk
- Pelicans Talk
- More Sports Board
- Fantasy Sports
- Golf Board
- Soccer Board
- O-T Lounge
- Tech Board
- Home/Garden Board
- Outdoor Board
- Health/Fitness Board
- Movie/TV Board
- Book Board
- Music Board
- Political Talk
- Money Talk
- Fark Board
- Gaming Board
- Travel Board
- Food/Drink Board
- Ticket Exchange
- TD Help Board
Customize My Forums- View All Forums
- Show Left Links
- Topic Sort Options
- Trending Topics
- Recent Topics
- Active Topics
Started By
Message
re: Daily COVID Updated as of 11/2/20 8:00 PM
Posted on 4/13/20 at 1:02 am to Chromdome35
Posted on 4/13/20 at 1:02 am to Chromdome35
I'm curious why we seem to see both new cases and new deaths peaking and declining at exactly the same time, when the deaths peak should be on a delay. Quite curious. Maybe we never really caught up with the rising number of cases, but we've hit the falling part of the slope.
Posted on 4/13/20 at 7:45 am to Microtiger
The hope for this week is to start seeing a small dip below the 33k-32k range. Hopefully we see a high volume testing day below 30k.
Posted on 4/13/20 at 8:25 am to Microtiger
quote:
I'm curious why we seem to see both new cases and new deaths peaking and declining at exactly the same time, when the deaths peak should be on a delay.
I think the death rate (hope I'm wrong) hangs on a little longer as new cases continue to drop. I wouldn't necessarily take the weekend numbers as gospel, either, until we clear tomorrow - that pattern (i.e. a spike on Monday or Tuesday) has been fairly reliable out of every weekend.
Posted on 4/13/20 at 9:29 am to uppermidwestbama
Curious why the testing volume has not drastically increased. IDK if its a reimbursement issue with the tests...? I know if private labs do not think they are going to make at least a small profit on them, then they are not going to be going all out. But, it seems with all the instruments out there now, the testing vol should have increased.
Posted on 4/13/20 at 9:31 am to jeffsdad
What happened to the individual state links within the website?
Posted on 4/13/20 at 9:47 am to jeffsdad
quote:
Curious why the testing volume has not drastically increased.
We’re only testing people with symptoms. We’re still only getting an 18-20% positive rate.
You can’t test more people than are sick. And there’s not a demonstrated benefit to testing people without symptoms at this point.
Posted on 4/13/20 at 10:19 am to Chromdome35
This is the link to the US state level tracker that I have shared via Google Drive. Chromdome's State Level COVID-19 Daily Tracker
This is the link to the COVID-19 Country tracker that I have shared on Google Drive. Chromdome's COVID-19 Daily Tracker
On the state level tracker the states I have available right now are listed below. I will be adding additional states in the coming days.
Arkansas, Louisiana, New York, Georgia, Florida, California
The source for the data is https://www.worldometers.info/coronavirus/
The source for the testing data is from https://covidtracking.com/data/
On the tracker sheet you will see tabs for the following data:
1) US Summary
2) Country Comparables: This shows you how the US stacks up vs. select other countries dealing with COVID-19
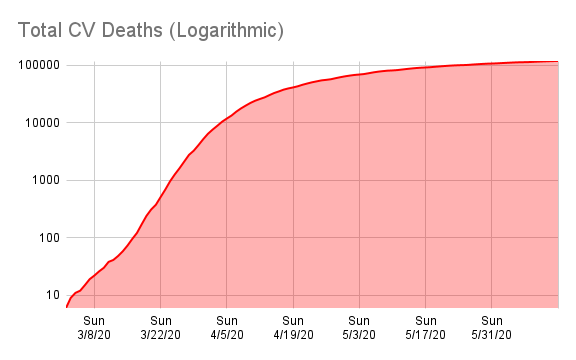
3) Logarithmic Comparisons - Shows the US vs the other countries on the tracker.
4) Covid Vs Other Outbreaks - Compares the current COVID numbers to the last 10 years of flue and H1N1
5) US Weighted Averages - Explores 7 day vs 3 day weight average trends
6) Italy Summary
7) UK Summary
8) France Summary
9) Germany Summary
10) Sweden Summary
11) World Summary
NOTE: The daily growth rate data will not be accurate until the end of the day's postings. It will change throughout the day.
NOTE: I am not tracking individual states, I don't have a reliable consistent source for that data.
NOTE: I am not a mathematician, statistics guru, scientist, sharpest tack in the box, I'm just a guy who likes to understand for myself what is happening and to share it with others. This thread was not created to debate if you should or shouldn't take this seriously, it is simply to present the numbers and foster conversation.
NOTE: I have added a prediction number to the bottom of the data grid. This simply takes the previous days numbers and grows them at the previous day's growth rate. It should give the viewer some idea of what the numbers will look like today. Obviously, the final number for the day will be higher or lower based on what today's growth rate actualy is. This is just a simple indicator.






This is the link to the COVID-19 Country tracker that I have shared on Google Drive. Chromdome's COVID-19 Daily Tracker
On the state level tracker the states I have available right now are listed below. I will be adding additional states in the coming days.
Arkansas, Louisiana, New York, Georgia, Florida, California
The source for the data is https://www.worldometers.info/coronavirus/
The source for the testing data is from https://covidtracking.com/data/
On the tracker sheet you will see tabs for the following data:
1) US Summary
2) Country Comparables: This shows you how the US stacks up vs. select other countries dealing with COVID-19
3) Logarithmic Comparisons - Shows the US vs the other countries on the tracker.
4) Covid Vs Other Outbreaks - Compares the current COVID numbers to the last 10 years of flue and H1N1
5) US Weighted Averages - Explores 7 day vs 3 day weight average trends
6) Italy Summary
7) UK Summary
8) France Summary
9) Germany Summary
10) Sweden Summary
11) World Summary
NOTE: The daily growth rate data will not be accurate until the end of the day's postings. It will change throughout the day.
NOTE: I am not tracking individual states, I don't have a reliable consistent source for that data.
NOTE: I am not a mathematician, statistics guru, scientist, sharpest tack in the box, I'm just a guy who likes to understand for myself what is happening and to share it with others. This thread was not created to debate if you should or shouldn't take this seriously, it is simply to present the numbers and foster conversation.
NOTE: I have added a prediction number to the bottom of the data grid. This simply takes the previous days numbers and grows them at the previous day's growth rate. It should give the viewer some idea of what the numbers will look like today. Obviously, the final number for the day will be higher or lower based on what today's growth rate actualy is. This is just a simple indicator.
Posted on 4/13/20 at 10:23 am to the808bass
At what point do the amount of people with symptoms start dropping dramatically. Seems like with the stay at home it eventually has to slow and I would imagine it will fall fast when it does.
Posted on 4/13/20 at 10:43 am to JakeMik
Some other stats people on the board here think it will drop slower than it ramped up. I don’t have the chops to suggest that or otherwise.
Posted on 4/13/20 at 10:49 am to Chromdome35
I bet we get another "Monday bump" from under-reported Sunday numbers.
Posted on 4/13/20 at 10:56 am to Chromdome35
(no message)
This post was edited on 4/13/20 at 11:33 am
Posted on 4/13/20 at 11:20 am to TideCPA
You can always tell when New York reports numbers.
Posted on 4/13/20 at 11:24 am to Chromdome35
Refresh your image links, baw.
Posted on 4/13/20 at 11:31 am to VoxDawg
It's not on my end...google docs has been acting up this morning. It's being slow to update.
Posted on 4/13/20 at 11:37 am to Chromdome35
Sometimes images like in the OP will time out. It has something to do with Chicken's Pride of 2003 message board engine.
Posted on 4/13/20 at 11:43 am to VoxDawg
quote:
Refresh your image links, baw.
Tigerdropping programming makes photos stop appearing in threads and only show links when the post turns one month old
Posted on 4/13/20 at 11:50 am to wickowick
Any way around that limitation?
Edit: I asked Chicken on the Help board if there was any way around this so my original post would keep showing the graphics.
Edit: I asked Chicken on the Help board if there was any way around this so my original post would keep showing the graphics.
This post was edited on 4/13/20 at 11:54 am
Posted on 4/13/20 at 12:13 pm to Chromdome35
quote:
Any way around that limitation?
Edit: I asked Chicken on the Help board if there was any way around this so my original post would keep showing the graphics.
Make a new thread if necessary?
Posted on 4/13/20 at 12:15 pm to Chromdome35
Can you edit post one and trick into thinking they're new pictures?
This post was edited on 4/13/20 at 12:16 pm
Posted on 4/13/20 at 12:23 pm to auisssa
Nope, that doesn't work.

 Page 167 of 331



Popular

Back to top
 Follow TigerDroppings for LSU Football News