




 1
1









- My Forums
- Tiger Rant
- LSU Recruiting
- SEC Rant
- Saints Talk
- Pelicans Talk
- More Sports Board
- Fantasy Sports
- Golf Board
- Soccer Board
- O-T Lounge
- Tech Board
- Home/Garden Board
- Outdoor Board
- Health/Fitness Board
- Movie/TV Board
- Book Board
- Music Board
- Political Talk
- Money Talk
- Fark Board
- Gaming Board
- Travel Board
- Food/Drink Board
- Ticket Exchange
- TD Help Board
Customize My Forums- View All Forums
- Show Left Links
- Topic Sort Options
- Trending Topics
- Recent Topics
- Active Topics
Started By
Message
re: Daily COVID Updated as of 11/2/20 8:00 PM
Posted on 4/7/20 at 7:24 pm to uppermidwestbama
Posted on 4/7/20 at 7:24 pm to uppermidwestbama
quote:
My state doesn't even report recoveries. They stay in the total state number.
Alabama apparently doesn't have any either. Pure nonsense.
Posted on 4/7/20 at 7:24 pm to auburn32
So what is Louisiana's story? Their death:total cases are up there with NY's and Michigan's, and greater than NJ's ratio. Does LA have a high senior-citizen proportion of their population?
This post was edited on 4/7/20 at 7:30 pm
Posted on 4/7/20 at 7:25 pm to Magician2
quote:Flu deaths are often revised upwards by a lot.
Is this the same for flu, pneumonia, and other virus deaths? If not this is inflating the number of deaths
For example, there were only about 18,036 confirmed case fatalities worldwide initially (we’re already at 82,000 and it’s growing with COVID-19).
Subsequent studies estimated the true number of fatalities to be between 151,700 and 575,400. That’s about 10 to 30 times more deaths.
And I think it’s likely that we’re undercounting deaths here too, as we have population level excess mortality data in the hardest hit regions indicating potentially thousands more deaths.
I mean I know of 2 deaths that were probably COVID-19 (1 almost certainly) that weren’t counted, but while we’re debating a case here and there, the reality is that their small measurements errors.
Posted on 4/7/20 at 7:31 pm to imjustafatkid
quote:You know the irony of your obsession with a statistic that is not important until we’re on the backside of the outbreak, is that if they started wasting time and resources on coding recoveries, there would be fewer recoveries and more deaths.
Alabama apparently doesn't have any either. Pure nonsense.
Posted on 4/7/20 at 7:32 pm to buckeye_vol
buckeye, your thoughts on the data so far this week? Are we seeing evidence of flattening?
Posted on 4/7/20 at 8:24 pm to auburn32
quote:
but couldn't get treatment because the hospitals were full with virus patients, I'd say that was a virus death.
As far as I know, despite the hype, not a single hospital in the United States is "overwhelmed"
Posted on 4/7/20 at 8:33 pm to ConwayGamecock
quote:
Does LA have a high senior-citizen proportion of their population?
LA has a out of control obesity/diabetes problem.
Posted on 4/7/20 at 8:37 pm to EA6B
quote:
LA has a out of control obesity/diabetes problem.
LA and Mississippi are consistently in the Top 3/Top 5 of most obese states. Colorado, conversely, is consistently in the bottom 3. This has been true since we've had reliable data, certainly back to the mid-80s and beyond.
Colorado, in 2020, is fatter than Louisiana was 30, 35 years ago.
Bottom line: America has an out of control obesity/diabetes problem and Louisiana is merely the vanguard.


Posted on 4/7/20 at 8:43 pm to Chromdome35
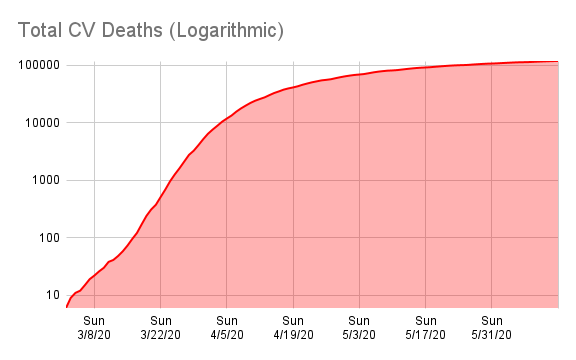
This is the link to the COVID-19 Country tracker that I have shared on Google Drive. Chromdome's COVID-19 Daily Tracker
This is the link to the US state level tracker that I have shared via Google Drive. Chromdome's State Level COVID-19 Daily Tracker
On the state level tracker the states I have available right now are listed below. I will be adding additional states in the coming days.
Arkansas, Louisiana, New York, Georgia, Florida, California
The source for the data is https://www.worldometers.info/coronavirus/
The source for the testing data is from https://covidtracking.com/data/
On the tracker sheet you will see tabs for the following data:
1) US Summary
2) Country Comparables: This shows you how the US stacks up vs. select other countries dealing with COVID-19
3) Logarithmic Comparisons - Shows the US vs the other countries on the tracker.
4) Covid Vs Other Outbreaks - Compares the current COVID numbers to the last 10 years of flue and H1N1
5) US Weighted Averages - Explores 7 day vs 3 day weight average trends
6) Italy Summary
7) UK Summary
8) France Summary
9) Germany Summary
10) Sweden Summary
11) World Summary
NOTE: The daily growth rate data will not be accurate until the end of the day's postings. It will change throughout the day.
NOTE: I am not tracking individual states, I don't have a reliable consistent source for that data.
NOTE: I am not a mathematician, statistics guru, scientist, sharpest tack in the box, I'm just a guy who likes to understand for myself what is happening and to share it with others. This thread was not created to debate if you should or shouldn't take this seriously, it is simply to present the numbers and foster conversation.
NOTE: I have added a prediction number to the bottom of the data grid. This simply takes the previous days numbers and grows them at the previous day's growth rate. It should give the viewer some idea of what the numbers will look like today. Obviously, the final number for the day will be higher or lower based on what today's growth rate actualy is. This is just a simple indicator.






This is the link to the US state level tracker that I have shared via Google Drive. Chromdome's State Level COVID-19 Daily Tracker
On the state level tracker the states I have available right now are listed below. I will be adding additional states in the coming days.
Arkansas, Louisiana, New York, Georgia, Florida, California
The source for the data is https://www.worldometers.info/coronavirus/
The source for the testing data is from https://covidtracking.com/data/
On the tracker sheet you will see tabs for the following data:
1) US Summary
2) Country Comparables: This shows you how the US stacks up vs. select other countries dealing with COVID-19
3) Logarithmic Comparisons - Shows the US vs the other countries on the tracker.
4) Covid Vs Other Outbreaks - Compares the current COVID numbers to the last 10 years of flue and H1N1
5) US Weighted Averages - Explores 7 day vs 3 day weight average trends
6) Italy Summary
7) UK Summary
8) France Summary
9) Germany Summary
10) Sweden Summary
11) World Summary
NOTE: The daily growth rate data will not be accurate until the end of the day's postings. It will change throughout the day.
NOTE: I am not tracking individual states, I don't have a reliable consistent source for that data.
NOTE: I am not a mathematician, statistics guru, scientist, sharpest tack in the box, I'm just a guy who likes to understand for myself what is happening and to share it with others. This thread was not created to debate if you should or shouldn't take this seriously, it is simply to present the numbers and foster conversation.
NOTE: I have added a prediction number to the bottom of the data grid. This simply takes the previous days numbers and grows them at the previous day's growth rate. It should give the viewer some idea of what the numbers will look like today. Obviously, the final number for the day will be higher or lower based on what today's growth rate actualy is. This is just a simple indicator.
Posted on 4/7/20 at 8:48 pm to Chromdome35
Wonder how much of the weekend bled into today?
Posted on 4/7/20 at 8:51 pm to Chromdome35
Tough day for deaths, 1,970. I think we may have a better understanding of what they meant by a Tough week for America.
The mortality rate continues to rise and is now at 3.21%.
At the current doubling rate for deaths, we're around 5-6 days from 25K deaths. It would be great if that's the peak.
The mortality rate continues to rise and is now at 3.21%.
At the current doubling rate for deaths, we're around 5-6 days from 25K deaths. It would be great if that's the peak.
Posted on 4/7/20 at 8:52 pm to ConwayGamecock
It's mostly NOLA
Mardi gras did no favors either
Mardi gras did no favors either
Posted on 4/7/20 at 8:55 pm to Chromdome35
New cases relatively flat for 5 days.
Bad news is those turn into mortalities 10-12 days out. We’re at the top of the curve (fingers crossed), but the numbers are going to be ugly going down.
Bad news is those turn into mortalities 10-12 days out. We’re at the top of the curve (fingers crossed), but the numbers are going to be ugly going down.
This post was edited on 4/7/20 at 8:56 pm
Posted on 4/7/20 at 8:58 pm to LosLobos111
We have hit the peak in total new confirmed cases daily.
There aren't any new outbreaks spiking in big numbers that will rise the total new confirmed cases at a great percentage. We have this under control.
Unfortantly there will continue to be a lot of death this week and weeks to come though. You just have to mentally accept that is reality and move on from it.
We are consistently seeing states see tiny growth, no growth, or droping in confirmed case growth rates. Over the next week we will see that in the nation wide numbers.
If you take out the NY and NJ numbers, the daily confirmed cases has been dropping for 4 days in a row now.
There aren't any new outbreaks spiking in big numbers that will rise the total new confirmed cases at a great percentage. We have this under control.
Unfortantly there will continue to be a lot of death this week and weeks to come though. You just have to mentally accept that is reality and move on from it.
We are consistently seeing states see tiny growth, no growth, or droping in confirmed case growth rates. Over the next week we will see that in the nation wide numbers.
If you take out the NY and NJ numbers, the daily confirmed cases has been dropping for 4 days in a row now.
Posted on 4/7/20 at 8:58 pm to uppermidwestbama
And many states are doing more testing and we are still seeing the line flattening for confirmed cases daily.
This post was edited on 4/7/20 at 8:59 pm
Posted on 4/7/20 at 9:01 pm to uppermidwestbama
I really think we're missing the point that new cases are flat because testing is flat. With the exception of Saturday 4/4 the number of tests have been hovering between around 125K...Thats going to yield about the same number of new cases per day every day which it is doing.
Posted on 4/7/20 at 9:07 pm to Chromdome35
Nope. My state alone has access to 13 laboratories where testing can be done. There is no backlog, unlike last month. A lot of people begging for a test are turned away since they don't fit the right clinical symptoms for a test.
Posted on 4/7/20 at 9:07 pm to Chromdome35
If spread was increasing wouldn’t more people be showing positive though?
Posted on 4/7/20 at 9:08 pm to Chromdome35
quote:
.Thats going to yield about the same number of new cases per day every day which it is doing.
But the number of hospitalizations in the hotspots is decreasing...as well as vent usage. That should tell us something...a good something I hope.
Posted on 4/7/20 at 9:09 pm to ConwayGamecock
We have a “large” population with many underlying conditions. We are not a healthy state.

 Page 148 of 331



Popular

Back to top
 Follow TigerDroppings for LSU Football News