




 2
2









- My Forums
- Tiger Rant
- LSU Recruiting
- SEC Rant
- Saints Talk
- Pelicans Talk
- More Sports Board
- Fantasy Sports
- Golf Board
- Soccer Board
- O-T Lounge
- Tech Board
- Home/Garden Board
- Outdoor Board
- Health/Fitness Board
- Movie/TV Board
- Book Board
- Music Board
- Political Talk
- Money Talk
- Fark Board
- Gaming Board
- Travel Board
- Food/Drink Board
- Ticket Exchange
- TD Help Board
Customize My Forums- View All Forums
- Show Left Links
- Topic Sort Options
- Trending Topics
- Recent Topics
- Active Topics
Started By
Message
re: Daily COVID Updated as of 11/2/20 8:00 PM
Posted on 4/3/20 at 5:44 pm to Chromdome35
Posted on 4/3/20 at 5:44 pm to Chromdome35
This is the link to the COVID-19 Country tracker that I have shared on Google Drive. Chromdome's COVID-19 Daily Tracker
This is the link to the US state-level tracker that I have shared via Google Drive. Chromdome's State Level COVID-19 Daily Tracker
On the state level tracker, the states I have available right now are listed below. I will be adding additional states in the coming days.
Arkansas, Louisiana, New York, Georgia, Florida, California
The source for the data is https://www.worldometers.info/coronavirus/
The source for the testing data is from https://covidtracking.com/data/
On the tracker sheet you will see tabs for the following data:
1) US Summary
2) Country Comparables: This shows you how the US stacks up vs. select other countries dealing with COVID-19
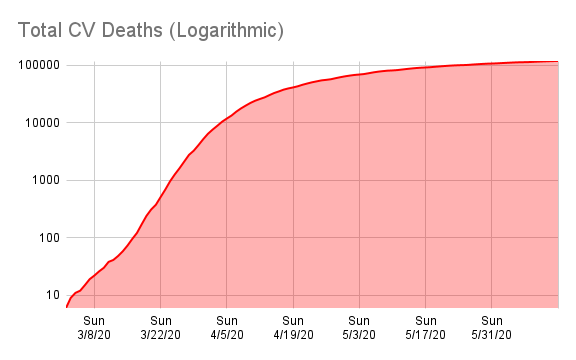
3) Logarithmic Comparisons - Shows the US vs the other countries on the tracker.
4) COVID Vs Other Outbreaks - Compares the current COVID numbers to the last 10 years of flue and H1N1
5) US Weighted Averages - Explores 7 day vs 3-day weight average trends
6) Italy Summary
7) UK Summary
8) France Summary
9) Germany Summary
10) Sweden Summary
11) World Summary
NOTE: The daily growth rate data will not be accurate until the end of the day's postings. It will change throughout the day.
NOTE: I am not tracking individual states, I don't have a reliable consistent source for that data.
NOTE: I am not a mathematician, statistics guru, scientist, sharpest tack in the box, I'm just a guy who likes to understand for myself what is happening and to share it with others. This thread was not created to debate if you should or shouldn't take this seriously, it is simply to present the numbers and foster conversation.
NOTE: I have added a prediction number to the bottom of the data grid. This simply takes the previous days' numbers and grows them at the previous day's growth rate. It should give the viewer some idea of what the numbers will look like today. Obviously, the final number for the day will be higher or lower based on what today's growth rate actually is. This is just a simple indicator.






This is the link to the US state-level tracker that I have shared via Google Drive. Chromdome's State Level COVID-19 Daily Tracker
On the state level tracker, the states I have available right now are listed below. I will be adding additional states in the coming days.
Arkansas, Louisiana, New York, Georgia, Florida, California
The source for the data is https://www.worldometers.info/coronavirus/
The source for the testing data is from https://covidtracking.com/data/
On the tracker sheet you will see tabs for the following data:
1) US Summary
2) Country Comparables: This shows you how the US stacks up vs. select other countries dealing with COVID-19
3) Logarithmic Comparisons - Shows the US vs the other countries on the tracker.
4) COVID Vs Other Outbreaks - Compares the current COVID numbers to the last 10 years of flue and H1N1
5) US Weighted Averages - Explores 7 day vs 3-day weight average trends
6) Italy Summary
7) UK Summary
8) France Summary
9) Germany Summary
10) Sweden Summary
11) World Summary
NOTE: The daily growth rate data will not be accurate until the end of the day's postings. It will change throughout the day.
NOTE: I am not tracking individual states, I don't have a reliable consistent source for that data.
NOTE: I am not a mathematician, statistics guru, scientist, sharpest tack in the box, I'm just a guy who likes to understand for myself what is happening and to share it with others. This thread was not created to debate if you should or shouldn't take this seriously, it is simply to present the numbers and foster conversation.
NOTE: I have added a prediction number to the bottom of the data grid. This simply takes the previous days' numbers and grows them at the previous day's growth rate. It should give the viewer some idea of what the numbers will look like today. Obviously, the final number for the day will be higher or lower based on what today's growth rate actually is. This is just a simple indicator.
This post was edited on 4/3/20 at 5:45 pm
Posted on 4/3/20 at 5:45 pm to Chromdome35
How is St Louis not being affected? They're a pretty big transportation hub. And with all the undesirables there, it's like Miami in the middle of the country yet they're not even close to being a hotspot.
How are Alabama, Mississippi and Arkansas not being affected? Maybe they're people don't travel much. In some ways this is not surprising (NYC) but in some ways it is very surprising.
How are Alabama, Mississippi and Arkansas not being affected? Maybe they're people don't travel much. In some ways this is not surprising (NYC) but in some ways it is very surprising.
Posted on 4/3/20 at 6:27 pm to CFFreak
The Abbott test is out and running tests now in various hot spots. We should reach our peak for new cases in about 7 to 9 days, IMO.
The new cases rate (confirmed cases) is slowing down.
We aren't that far from being well below 13% for new daily confirmed cases.
The new cases rate (confirmed cases) is slowing down.
We aren't that far from being well below 13% for new daily confirmed cases.
Posted on 4/3/20 at 6:31 pm to uppermidwestbama
300 deaths in NYC today. NO surrpise since they had 2k in the ICU rooms several days ago.
Date Cases-Hosp
3/30 4042-896
3/31 3096-694
4/01 2761-567
4/02 2037-113
For NYC that trend means the deaths aren't going to peak for about another 10 days?
Date Cases-Hosp
3/30 4042-896
3/31 3096-694
4/01 2761-567
4/02 2037-113
For NYC that trend means the deaths aren't going to peak for about another 10 days?
Posted on 4/3/20 at 6:35 pm to uppermidwestbama
NY just updated to 680 Deaths
This post was edited on 4/3/20 at 6:35 pm
Posted on 4/3/20 at 6:47 pm to Chromdome35
https://7news.com.au/lifestyle/health-wellbeing/anti-parasitic-drug-kills-covid-19-in-lab-c-955457
Coronavirus: Anti-parasitic drug Ivermectin kills COVID-19 in lab within 48 hours
Coronavirus: Anti-parasitic drug Ivermectin kills COVID-19 in lab within 48 hours
Posted on 4/3/20 at 6:57 pm to zatetic
Thanks for posting.
Posted on 4/3/20 at 7:15 pm to CFFreak
quote:Pretty sure St. Louis has been affected. St. Louis has 275 cases. It isn't a big city.
How is St Louis not being affected? They're a pretty big transportation hub. And with all the undesirables there, it's like Miami in the middle of the country yet they're not even close to being a hotspot.
quote:It really isn't surprising at all. But don't worry, they are all starting to jump up in cases now.
How are Alabama, Mississippi and Arkansas not being affected? Maybe they're people don't travel much. In some ways this is not surprising (NYC) but in some ways it is very surprising.
Posted on 4/3/20 at 7:16 pm to Chromdome35
quote:
NY just updated to 680 Deaths
*sigh*
That's a big jump.
Posted on 4/3/20 at 7:16 pm to zatetic
Maybe another bullet for the gun, but working in vitro and working on a human or two different things.
Posted on 4/3/20 at 7:21 pm to mmcgrath
quote:
Pretty sure St. Louis has been affected. St. Louis has 275 cases. It isn't a big city.
St. Louis city has 300,000 people. 1 out of 1,000 people has a confirmed case.
Posted on 4/3/20 at 8:02 pm to the808bass
This mortality rate is 100% bullshite. My wife is a RN and has been noticing everyone RECOVERING. She has a ton of other nurse friends in her network that are all saying the same thing. They don’t have a clue where all these deaths are coming from within the state. From obese people with asthma making full recoveries within a week now, and 70+ yr old people getting off vents and going home.
I’m calling bs, at least inside of Louisiana. I can’t say about the others.
I’m calling bs, at least inside of Louisiana. I can’t say about the others.
Posted on 4/3/20 at 8:28 pm to Chromdome35
Chrome,
just a simple question. If total deaths for 4/1 was 1049 and for 4/2 was 969, how come the growth rate shows a 19% increate for 4/2?
just a simple question. If total deaths for 4/1 was 1049 and for 4/2 was 969, how come the growth rate shows a 19% increate for 4/2?
Posted on 4/3/20 at 8:33 pm to PeteRose
The 19 percent isn’t the percent increase of the previous days new totals. It’s the percent of new deaths to total deaths.
Edit : 4/2 New total deaths (969) divided by Overall deaths up to the previous day (5102) = 19%
Edit : 4/2 New total deaths (969) divided by Overall deaths up to the previous day (5102) = 19%
This post was edited on 4/3/20 at 8:39 pm
Posted on 4/3/20 at 8:46 pm to Chromdome35
This is the link to the COVID-19 Country tracker that I have shared on Google Drive. Chromdome's COVID-19 Daily Tracker
This is the link to the US state level tracker that I have shared via Google Drive. Chromdome's State Level COVID-19 Daily Tracker
On the state level tracker the states I have available right now are listed below. I will be adding additional states in the coming days.
Arkansas, Louisiana, New York, Georgia, Florida, California
The source for the data is https://www.worldometers.info/coronavirus/
The source for the testing data is from https://covidtracking.com/data/
On the tracker sheet you will see tabs for the following data:
1) US Summary
2) Country Comparables: This shows you how the US stacks up vs. select other countries dealing with COVID-19
3) Logarithmic Comparisons - Shows the US vs the other countries on the tracker.
4) Covid Vs Other Outbreaks - Compares the current COVID numbers to the last 10 years of flue and H1N1
5) US Weighted Averages - Explores 7 day vs 3 day weight average trends
6) Italy Summary
7) UK Summary
8) France Summary
9) Germany Summary
10) Sweden Summary
11) World Summary
NOTE: The daily growth rate data will not be accurate until the end of the day's postings. It will change throughout the day.
NOTE: I am not tracking individual states, I don't have a reliable consistent source for that data.
NOTE: I am not a mathematician, statistics guru, scientist, sharpest tack in the box, I'm just a guy who likes to understand for myself what is happening and to share it with others. This thread was not created to debate if you should or shouldn't take this seriously, it is simply to present the numbers and foster conversation.
NOTE: I have added a prediction number to the bottom of the data grid. This simply takes the previous days numbers and grows them at the previous day's growth rate. It should give the viewer some idea of what the numbers will look like today. Obviously, the final number for the day will be higher or lower based on what today's growth rate actualy is. This is just a simple indicator.

This is the link to the US state level tracker that I have shared via Google Drive. Chromdome's State Level COVID-19 Daily Tracker
On the state level tracker the states I have available right now are listed below. I will be adding additional states in the coming days.
Arkansas, Louisiana, New York, Georgia, Florida, California
The source for the data is https://www.worldometers.info/coronavirus/
The source for the testing data is from https://covidtracking.com/data/
On the tracker sheet you will see tabs for the following data:
1) US Summary
2) Country Comparables: This shows you how the US stacks up vs. select other countries dealing with COVID-19
3) Logarithmic Comparisons - Shows the US vs the other countries on the tracker.
4) Covid Vs Other Outbreaks - Compares the current COVID numbers to the last 10 years of flue and H1N1
5) US Weighted Averages - Explores 7 day vs 3 day weight average trends
6) Italy Summary
7) UK Summary
8) France Summary
9) Germany Summary
10) Sweden Summary
11) World Summary
NOTE: The daily growth rate data will not be accurate until the end of the day's postings. It will change throughout the day.
NOTE: I am not tracking individual states, I don't have a reliable consistent source for that data.
NOTE: I am not a mathematician, statistics guru, scientist, sharpest tack in the box, I'm just a guy who likes to understand for myself what is happening and to share it with others. This thread was not created to debate if you should or shouldn't take this seriously, it is simply to present the numbers and foster conversation.
NOTE: I have added a prediction number to the bottom of the data grid. This simply takes the previous days numbers and grows them at the previous day's growth rate. It should give the viewer some idea of what the numbers will look like today. Obviously, the final number for the day will be higher or lower based on what today's growth rate actualy is. This is just a simple indicator.
Posted on 4/3/20 at 8:46 pm to PeteRose
969 deaths that day/5102 deaths total
Posted on 4/3/20 at 8:47 pm to PeteRose
Lurking Tiger is correct in his response.
Posted on 4/3/20 at 8:56 pm to Chromdome35
The growth rate of new cases continues to slow, falling now to 13.2%. However, the total number of new cases reached a new high of 32.2K. The new cases days to double will continue to increase. I still believe the new case growth rate is constrained by testing. As faster tests come online, we will see the growth rate start to increase.
New Deaths reached a new high at 1,321 a day a 21.8% increase over yesterday; however, the growth rate of deaths does seem to be slowing, the days to double rate will be in the mid 4's tomorrow which continues a 9-day slowing trend.
We are about 3 days away from passing the death toll of the H1N1 outbreak.
The mortality rate continues to grow and is now up to 2.67%. Again I suspect this is a byproduct of the testing constraint on new case growth. There is no such constraint on deaths so the ratio of deaths to cases is increasing.
Testing took a big jump up today rising 139K from yesterday to the highest number yet. I wonder if this is due to the impact of faster testing coming online, or are the labs clearing their bottlenecks?
I sourced new information today on hospitalizations, ICU cases and vent cases. The data looks incomplete to me as not all states are reporting it. You can see this data by scrolling to the right on the tracker. This is a screen snippet of it.

New Deaths reached a new high at 1,321 a day a 21.8% increase over yesterday; however, the growth rate of deaths does seem to be slowing, the days to double rate will be in the mid 4's tomorrow which continues a 9-day slowing trend.
We are about 3 days away from passing the death toll of the H1N1 outbreak.
The mortality rate continues to grow and is now up to 2.67%. Again I suspect this is a byproduct of the testing constraint on new case growth. There is no such constraint on deaths so the ratio of deaths to cases is increasing.
Testing took a big jump up today rising 139K from yesterday to the highest number yet. I wonder if this is due to the impact of faster testing coming online, or are the labs clearing their bottlenecks?
I sourced new information today on hospitalizations, ICU cases and vent cases. The data looks incomplete to me as not all states are reporting it. You can see this data by scrolling to the right on the tracker. This is a screen snippet of it.
This post was edited on 4/3/20 at 8:57 pm
Posted on 4/3/20 at 9:02 pm to Chromdome35
For anyone who looks at the LDH website for updates, I have a question. When it says "patients in Hospital", I'm "assuming" that this is minus any that have been discharged or died, correct? I mean "in hospital" is what that "should" mean but you know ...
I guess I'm wondering how do discharges play into this? As people die and admits lessen (both cases therefore freeing up beds), that number should technically go down.
I'm so frustrated with the numbers JBE keeps giving ... says that 2500 beds per day in the NOLA area will be needed by May .. can y'all see that? I'm not a numbers person but I can't fathom that. Testing sites were consolidated as testing needs were going down. What gives???
I guess I'm wondering how do discharges play into this? As people die and admits lessen (both cases therefore freeing up beds), that number should technically go down.
I'm so frustrated with the numbers JBE keeps giving ... says that 2500 beds per day in the NOLA area will be needed by May .. can y'all see that? I'm not a numbers person but I can't fathom that. Testing sites were consolidated as testing needs were going down. What gives???
Posted on 4/3/20 at 9:02 pm to Chromdome35
You have cumulative icu below current icu. Should that be reversed or am I misunderstanding?

 Page 129 of 331



Popular

Back to top
 Follow TigerDroppings for LSU Football News