




 0
0






- My Forums
- Tiger Rant
- LSU Recruiting
- SEC Rant
- Saints Talk
- Pelicans Talk
- More Sports Board
- Fantasy Sports
- Golf Board
- Soccer Board
- O-T Lounge
- Tech Board
- Home/Garden Board
- Outdoor Board
- Health/Fitness Board
- Movie/TV Board
- Book Board
- Music Board
- Political Talk
- Money Talk
- Fark Board
- Gaming Board
- Travel Board
- Food/Drink Board
- Ticket Exchange
- TD Help Board
Customize My Forums- View All Forums
- Show Left Links
- Topic Sort Options
- Trending Topics
- Recent Topics
- Active Topics
Started By
Message
re: Daily COVID Updated as of 11/2/20 8:00 PM
Posted on 4/2/20 at 10:55 am to TOPAL
Posted on 4/2/20 at 10:55 am to TOPAL
quote:
I would like to know what is the age, if patient was obese and if the patient had diabetes or heart conditions for the infected that died.
nope. You COVID now. You ded. COVID. CO-VID!
Posted on 4/2/20 at 10:56 am to tiger91
quote:
JBE is getting to me with the need for "thousands and thousands" of ventilators being needed thing.
I haven’t seen any models that project even 1,000 total needed ventilators. Let alone 1,000 additional vents. Having said that, Louisiana probably could use 100 vents in a state reserve.
Posted on 4/2/20 at 11:00 am to trinidadtiger
quote:
We really should invest some testing on random folks. especially in the non-hotspot areas.
The plasma industry will be able to do this in the coming months. It'll be interesting to get antibody titers from donors that never got a positive test. I know that's down the road a bit, but the data should be fascinating.
Posted on 4/2/20 at 11:05 am to the808bass
quote:It's the government. Ask for 1000s, get a hundred if you're lucky.
Let alone 1,000 additional vents. Having said that, Louisiana probably could use 100 vents in a state reserve.
Posted on 4/2/20 at 11:38 am to Chromdome35
How to tell when we've peaked...Look at Italy's new cases by day graph vs. the same from the US. You can see how the new cases per day are declining for Italy while increasing for the US.


Posted on 4/2/20 at 11:39 am to the808bass
808bass supposedly 150 are on the way from the government.
Also, this is the governor who said that there would be no LSU football if a budget wasn't passed. Fear mongering.
Also, this is the governor who said that there would be no LSU football if a budget wasn't passed. Fear mongering.
Posted on 4/2/20 at 11:50 am to tiger91
Where does the task force get their estimated numbers?
Posted on 4/2/20 at 11:53 am to tiger91
quote:
150 are on the way from the government.
As of yesterday Louisiana had 480 people on vents for CV (as per radio guy). We shouldn't need thousands at any time. Some models are predicting we peak around April 10th...since most models have been wrong to the plus side I'm hoping this will be the case.
Posted on 4/2/20 at 11:59 am to TOPAL
quote:
I would like to know what is the age, if patient was obese and if the patient had diabetes or heart conditions for the infected that died.
From what I have read, and from talking to medical personal in the hospitals resting virus patients, the one issue common to those under age 70 that have died, and those that are in the ICU is obesity.
Posted on 4/2/20 at 12:05 pm to EA6B
That goes with what the "numbers guys" from a few hospitals are saying in the OT thread/various other threads.
Posted on 4/2/20 at 12:10 pm to Chromdome35
quote:
How to tell when we've peaked...Look at Italy's new cases by day graph vs. the same from the US. You can see how the new cases per day are declining for Italy while increasing for the US.
How many "days behind" Italy are we?
Posted on 4/2/20 at 12:12 pm to tiger91
New York's morning drop was better than it's been (154 deaths), but New Jersey's was absolutely brutal (182 - their previous TOTAL was 355).
Posted on 4/2/20 at 12:23 pm to Chromdome35
Canada, the low countries, latin America starting to have trouble.

Posted on 4/2/20 at 12:24 pm to TigerDoc
I still want to know how it got to Greenland 
Posted on 4/2/20 at 12:25 pm to HailHailtoMichigan!
The Q thread says it was brought there by Eric the Red.
(j/k)
(j/k)
Posted on 4/2/20 at 12:38 pm to TideCPA
quote:
New York's morning drop was better than it's been (154 deaths), but New Jersey's was absolutely brutal (182 - their previous TOTAL was 355).
What's with Florida's huge jump? New York transfers?
Posted on 4/2/20 at 12:40 pm to DMAN1968
They didn't go to shelter-in-place until yesterday, had beaches open for spring break with students from all over there before that.
ETA: international regional comparison including FL (they should take out Wuhan. Its numbers are a question mark.)

ETA: international regional comparison including FL (they should take out Wuhan. Its numbers are a question mark.)
This post was edited on 4/2/20 at 12:54 pm
Posted on 4/2/20 at 1:00 pm to TigerDoc
quote:
the low countries
Now is not the time for name calling.
Posted on 4/2/20 at 1:09 pm to Chromdome35
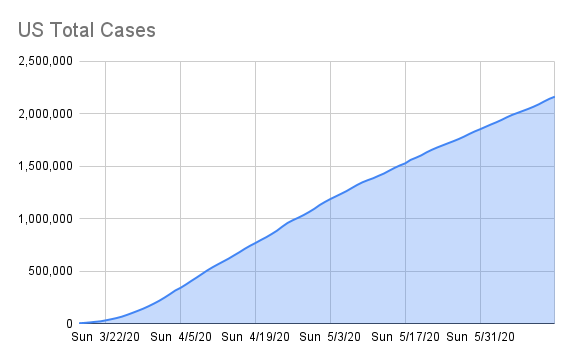
This is the link to the COVID-19 tracker that I have shared on Google Drive. Chromdome's COVID-19 Daily Tracker
The source for the data is https://www.worldometers.info/coronavirus/
The source for the testing data is from https://covidtracking.com/data/
On the tracker sheet you will see tabs for the following data:
1) US Summary
2) Country Comparables: This shows you how the US stacks up vs. select other countries dealing with COVID-19
3) Logarithmic Comparisons - Shows the US vs the other countries on the tracker.
4) Covid Vs Other Outbreaks - Compares the current COVID numbers to the last 10 years of flue and H1N1
5) US Weighted Averages - Explores 7 day vs 3 day weight average trends
6) Italy Summary
7) UK Summary
8) France Summary
9) Germany Summary
10) Sweden Summary
11) World Summary
NOTE: The daily growth rate data will not be accurate until the end of the day's postings. It will change throughout the day.
NOTE: I am not tracking individual states, I don't have a reliable consistent source for that data.
NOTE: I am not a mathematician, statistics guru, scientist, sharpest tack in the box, I'm just a guy who likes to understand for myself what is happening and to share it with others. This thread was not created to debate if you should or shouldn't take this seriously, it is simply to present the numbers and foster conversation.
NOTE: I have added a prediction number to the bottom of the data grid. This simply takes the previous days numbers and grows them at the previous day's growth rate. It should give the viewer some idea of what the numbers will look like today. Obviously, the final number for the day will be higher or lower based on what today's growth rate actualy is. This is just a simple indicator.



The source for the data is https://www.worldometers.info/coronavirus/
The source for the testing data is from https://covidtracking.com/data/
On the tracker sheet you will see tabs for the following data:
1) US Summary
2) Country Comparables: This shows you how the US stacks up vs. select other countries dealing with COVID-19
3) Logarithmic Comparisons - Shows the US vs the other countries on the tracker.
4) Covid Vs Other Outbreaks - Compares the current COVID numbers to the last 10 years of flue and H1N1
5) US Weighted Averages - Explores 7 day vs 3 day weight average trends
6) Italy Summary
7) UK Summary
8) France Summary
9) Germany Summary
10) Sweden Summary
11) World Summary
NOTE: The daily growth rate data will not be accurate until the end of the day's postings. It will change throughout the day.
NOTE: I am not tracking individual states, I don't have a reliable consistent source for that data.
NOTE: I am not a mathematician, statistics guru, scientist, sharpest tack in the box, I'm just a guy who likes to understand for myself what is happening and to share it with others. This thread was not created to debate if you should or shouldn't take this seriously, it is simply to present the numbers and foster conversation.
NOTE: I have added a prediction number to the bottom of the data grid. This simply takes the previous days numbers and grows them at the previous day's growth rate. It should give the viewer some idea of what the numbers will look like today. Obviously, the final number for the day will be higher or lower based on what today's growth rate actualy is. This is just a simple indicator.

 Page 122 of 331



Popular

Back to top
 Follow TigerDroppings for LSU Football News