- My Forums
- Tiger Rant
- LSU Recruiting
- SEC Rant
- Saints Talk
- Pelicans Talk
- More Sports Board
- Fantasy Sports
- Golf Board
- Soccer Board
- O-T Lounge
- Tech Board
- Home/Garden Board
- Outdoor Board
- Health/Fitness Board
- Movie/TV Board
- Book Board
- Music Board
- Political Talk
- Money Talk
- Fark Board
- Gaming Board
- Travel Board
- Food/Drink Board
- Ticket Exchange
- TD Help Board
Customize My Forums- View All Forums
- Show Left Links
- Topic Sort Options
- Trending Topics
- Recent Topics
- Active Topics
Started By
Message
re: Daily COVID Updated as of 11/2/20 8:00 PM
Posted on 7/14/20 at 3:08 pm to gthog61
Posted on 7/14/20 at 3:08 pm to gthog61
Another day in, another day closer to the end of the 14 day window, and now Fulton, Cobb and DeKalb ALL peak on July 1. Gwinnett peaked on June 28, with a smaller peak on July 2. Yep, no doubt an amazing coincidence. And the peaks are becoming very defined, by Friday the data is going to be very interesting if it continues like this.
 0
0

Posted on 7/14/20 at 3:28 pm to HailHailtoMichigan!
quote:
132 deaths in Florida.
78 of the deaths occurred in july, rest occurred in june
crimsonains, you HAVE to disclose this. We don't even know when in july these deaths occurred.
It makes it IMPOSSIBLE to study trends when some of these deaths occurred weeks ago.
I already said the numbers are inflated. I know 132 didn't die yesterday.

Posted on 7/14/20 at 4:50 pm to nerd guy
quote:
This certainly seems to be the case. Rio Grande valley getting hit hard along with other border areas. Tarrant seems to be on the downside with ER visits related to covid symptoms and % positive peaking 10 days ago. Hospital number should start to drop within a week or so.
Seems like almost a fake number, but I watched the Abbott presser yesterday and I'm almost positive that's what it was.
Posted on 7/14/20 at 5:32 pm to TeLeFaWx
Where does everybody find the actual daily deaths per state instead of the reported deaths?
Posted on 7/14/20 at 5:39 pm to Crimsonians
Check out each state's department of public health site, most of them have that data. Here's a link to Georgia's, puts a little context to my posts the last few days. Anything inside of 14 days in the past is still subject to change, hence my harping on the 14 days. You can see at the state and county levels.
LINK
LINK
This post was edited on 7/14/20 at 5:40 pm
Posted on 7/14/20 at 5:42 pm to AUMIS01
That was tough to figure out.
Posted on 7/14/20 at 5:50 pm to Chromdome35
This is the link to the COVID-19 tracker that I have created and shared on Google Drive.
If you want to view the shared sheet, follow this link COVID-19 Tracker
If you want to download a copy of this sheet and manipulate it follow this link Downloadable COVID-19 Tracker
The source for the data is from https://covidtracking.com/data/


New Cases by State

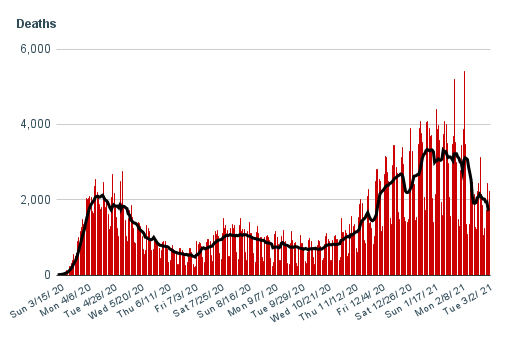
New Deaths by State

7-day average growth rate of new cases

If you want to view the shared sheet, follow this link COVID-19 Tracker
If you want to download a copy of this sheet and manipulate it follow this link Downloadable COVID-19 Tracker
The source for the data is from https://covidtracking.com/data/
New Cases by State
New Deaths by State
7-day average growth rate of new cases
Posted on 7/14/20 at 6:01 pm to Chromdome35
736 isn't too bad for a Tuesday, considering the Florida dump... right?
Posted on 7/14/20 at 6:01 pm to Chromdome35
The US is testing 5M people a week and as the testing volume has increased we are now seeing a definite flattening of the positivity rate as you can tell by this near term graph.

With testing driving the new caseload if testing continues to increase and the positivity rate starts to fall, then we can expect to see a leveling off in the new case rate and the start of a decline maybe. What is more important is the death rate.
Deaths today were 736 which reflects the normal Tuesday bump. What I am looking at is the last week, where deaths spiked up, but are still following the downward trend since the spike. It looks like we reset the death curve back to 6/9 levels. Lets hope it resumes the downward pattern that it was displaying on 6/9
Posted on 7/14/20 at 6:34 pm to Chromdome35
Encouraging numbers today. The next 7-10 days are so critical.
Posted on 7/15/20 at 1:47 pm to AUMIS01
Looking at Louisiana again...15 Jul
percentage of deaths to cases reported - 3.98%
percentage of cases reported to tests performed 8.4%
death rate continues to drop, but based on what I've been hearing about testing.....who knows...sounds to me like the databases need to be scrubbed and multiple tests of the same person need to be removed...

Posted on 7/15/20 at 1:52 pm to vl100butch
Latest excess deaths info, which is the best way to do international comparisons (makes up for vast differences in testing). Mind that the latest available data is different for each country, so comparisons are still difficult.


Posted on 7/15/20 at 3:20 pm to TigerDoc
Texas has over 70 more deaths to report.
Another day around 800.
Another day around 800.
Posted on 7/15/20 at 3:22 pm to the808bass
Posted on 7/15/20 at 3:33 pm to the808bass
Two Wednesdays ago we were above 700, so that's still not that bad considering all the states dumping deaths randomly.
Posted on 7/15/20 at 3:48 pm to Eat Your Crow
quote:
Two Wednesdays ago we were above 700, so that's still not that bad considering all the states dumping deaths randomly.
Yeah. It’s looking more like a flattening of the tail based on regional outbreaks that didn’t experience an initial outbreak.
Posted on 7/15/20 at 3:51 pm to the808bass
It’s crazy that nursing home visitors are still banned in Texas, but spread is still happening through staff alone.
Posted on 7/15/20 at 4:16 pm to Athanatos
I'm not sure how this impacts the great data tracking & analysis done in this thread but this was from the official Texas Covid Dashboard which Gov Abbott frequently cites when he makes his decisions-->
Texas is reporting 10,791 new confirmed COVID-19 cases for Wednesday, July 15. The San Antonio Metro Health District has clarified its reporting to separate confirmed and probable cases, so the Bexar County and statewide totals have been updated to remove 3,484 probable cases. The local case count previously included probable cases identified by antigen testing but not those from antibody testing or other sources.
Texas is reporting 10,791 new confirmed COVID-19 cases for Wednesday, July 15. The San Antonio Metro Health District has clarified its reporting to separate confirmed and probable cases, so the Bexar County and statewide totals have been updated to remove 3,484 probable cases. The local case count previously included probable cases identified by antigen testing but not those from antibody testing or other sources.
Posted on 7/15/20 at 5:35 pm to Chromdome35
This is the link to the COVID-19 tracker that I have created and shared on Google Drive.
If you want to view the shared sheet, follow this link COVID-19 Tracker
If you want to download a copy of this sheet and manipulate it follow this link Downloadable COVID-19 Tracker
The source for the data is from https://covidtracking.com/data/


New Cases by State
New Deaths by State
7-day average growth rate of new cases
If you want to view the shared sheet, follow this link COVID-19 Tracker
If you want to download a copy of this sheet and manipulate it follow this link Downloadable COVID-19 Tracker
The source for the data is from https://covidtracking.com/data/
New Cases by State
New Deaths by State
7-day average growth rate of new cases
Posted on 7/15/20 at 5:43 pm to Chromdome35
New Cases are up to the 2nd highest day yet and the highest Wednesday new cases to date. This is a result of 756K tests with a positivity rate of 8.6%.
The short term positivity rate remains flat while testing volume increases. This is a good thing.
More concerning are the 855 new deaths. This is against the downward trending, the next few days will tell us if we're seeing a rise in the death rate.
We're adding 65K of positive cases a day and our hospitals are feeling the pressure, but think of it this way, that VAST majority of those daily 65K cases are not ending up in the hospital. If they were, our hospitals would be overrun in a matter of days and that is not happening. That said, even a continued slow steady increase on hospitalizations and we will start seeing some strain in the system before long.
The US is now running an average of 5 Million tests a week. That is pretty amazing. Think of the supply chain needed to support that. I hope its all made in the USA, does anyone know where the testing supplies are being sourced?
This post was edited on 7/15/20 at 5:49 pm

 Page 262 of 331

Back to top