




 2
2









- My Forums
- Tiger Rant
- LSU Recruiting
- SEC Rant
- Saints Talk
- Pelicans Talk
- More Sports Board
- Fantasy Sports
- Golf Board
- Soccer Board
- O-T Lounge
- Tech Board
- Home/Garden Board
- Outdoor Board
- Health/Fitness Board
- Movie/TV Board
- Book Board
- Music Board
- Political Talk
- Money Talk
- Fark Board
- Gaming Board
- Travel Board
- Food/Drink Board
- Ticket Exchange
- TD Help Board
Customize My Forums- View All Forums
- Show Left Links
- Topic Sort Options
- Trending Topics
- Recent Topics
- Active Topics
Started By
Message
re: Daily COVID Updated as of 11/2/20 8:00 PM
Posted on 3/24/20 at 9:32 am to Chromdome35
Posted on 3/24/20 at 9:32 am to Chromdome35
This is a link to the tracker that I have shared on Google Drive.
Chromdome's COVID-19 Daily Tracker
There are a lot more graphs available at the link above

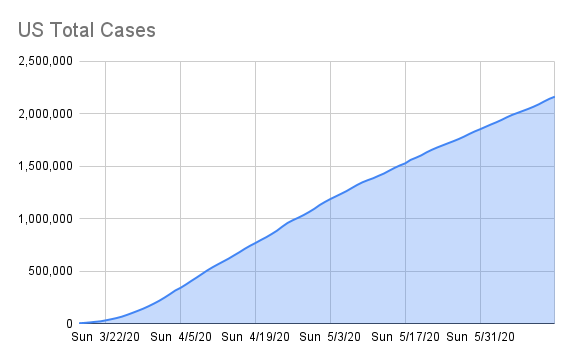



I need some feedback, on the google sheet, I have created tabs for other countries, can you see those? I can't tell if i have the security set right for you to be able to access the other tabs of data.
Chromdome's COVID-19 Daily Tracker
There are a lot more graphs available at the link above
I need some feedback, on the google sheet, I have created tabs for other countries, can you see those? I can't tell if i have the security set right for you to be able to access the other tabs of data.
This post was edited on 3/24/20 at 9:53 am
Posted on 3/24/20 at 10:06 am to Chromdome35
quote:
I need some feedback, on the google sheet, I have created tabs for other countries, can you see those?
Yes, I can see them
Posted on 3/24/20 at 10:15 am to Chromdome35
That looks like great news for Italy. Weren't they saying we were 11 days behind them? Does that still hold true?
Posted on 3/24/20 at 10:18 am to nerd guy
Worldometers added a deaths per million column in the last day or so. IMO this is the best figure for evaluating how countries are dealing with the virus.
US is basically even with Germany and South Korea now.
US is basically even with Germany and South Korea now.
Posted on 3/24/20 at 10:19 am to TideCPA
Yea I put that on my country comparables tab yesterday, before WM started showing it.
Posted on 3/24/20 at 10:19 am to nerd guy
You’re not hearing that as much because we have 50% of the deaths Italy had 11 days ago. You’ll keep hearing less of it as the divide widens.
Posted on 3/24/20 at 10:19 am to Olive
Thank you Olive!
Posted on 3/24/20 at 10:52 am to RollTide1987
Predictions?
Not sure why predictions are pertinent when you have data, but no where have I seen any predictions that this week is the peak. Do you mind sharing that with us?
Not sure why predictions are pertinent when you have data, but no where have I seen any predictions that this week is the peak. Do you mind sharing that with us?
Posted on 3/24/20 at 11:20 am to the808bass
It would be cool if someone was reporting "test given" vs "results received". Then we would know the potential of new case numbers.
That active case number growth is still sort of distorted given the differing times it takes for results to get in. Maybe "average age of results" or something would help.
This is very helpful thread and Chrome deserves a bit TD pat on the back!
That active case number growth is still sort of distorted given the differing times it takes for results to get in. Maybe "average age of results" or something would help.
This is very helpful thread and Chrome deserves a bit TD pat on the back!
Posted on 3/24/20 at 11:58 am to I B Freeman
Some anecdotes: my friend was started on chloroquine and Zpack yesterday. He’s very ill. Day 14 for him. Still on oxygen.
A hospital in the Midwest has had 22 positive test results. Unfortunately, 7 are staff. Don’t go to the hospital.
A young lady in her 30s passed yesterday in St Louis. She admitted to the hospital last Tuesday and was on a vent in 24 hours. No word on underlying conditions.
A hospital in the Midwest has had 22 positive test results. Unfortunately, 7 are staff. Don’t go to the hospital.
A young lady in her 30s passed yesterday in St Louis. She admitted to the hospital last Tuesday and was on a vent in 24 hours. No word on underlying conditions.
Posted on 3/24/20 at 11:59 am to I B Freeman
Missouri seems to be turning tests around within 24 hours.
Posted on 3/24/20 at 12:14 pm to the808bass
One thing the worldmeters site is way behind on is recoveries. It list only 362 recoveries. For Tennessee, it lists 615 cases, 2 deaths and 613 active cases. Nashville mayor presser yesterday gave numbers for Davidson County and listed 27 cases as fully recovered.
This post was edited on 3/24/20 at 12:15 pm
Posted on 3/24/20 at 12:18 pm to Volsfan82169
Italy’s number just updated. 5249 new cases, 743 deaths for the day. They are near 10% mortality rate.
Posted on 3/24/20 at 12:21 pm to Volsfan82169
Lots of old people + few ICU beds is a bad combo to have.
Posted on 3/24/20 at 12:23 pm to Volsfan82169
The tracker is updated for Italy
Posted on 3/24/20 at 12:34 pm to Chromdome35
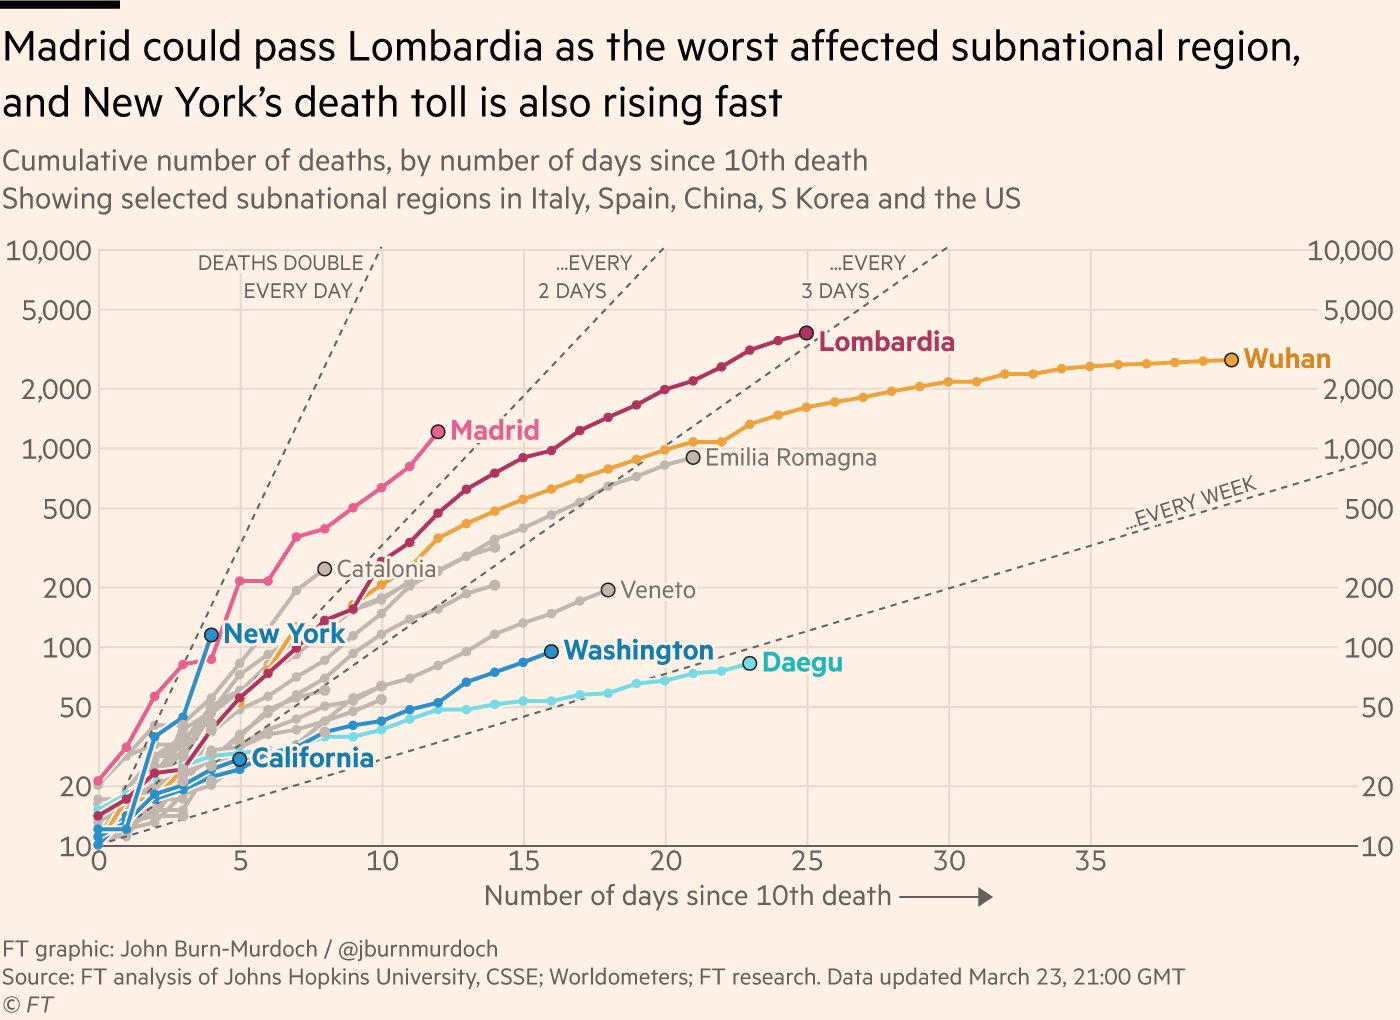
Growth in COVID fatalities by region. steepness for NYC is terrible. Unfortunately, no Louisiana (but it would be steeper than any other, unfortunately - deaths doubling faster than every 2 days since hitting the 10th death mark on this chart).
This post was edited on 3/24/20 at 12:39 pm
Posted on 3/24/20 at 12:43 pm to TigerDoc
Tigerdoc, where are you sourcing that graphic from. I really like it and the others I've seen posted.
Posted on 3/24/20 at 12:50 pm to Chromdome35
John Burn-Murdoch (@Jburnmurdoch on twitter). He's London's Financial Times' guy for graphics and I agree he does a nice job presenting this data graphically.
This post was edited on 3/24/20 at 12:51 pm
Posted on 3/24/20 at 12:54 pm to TigerDoc
Great stuff, thank you!
Posted on 3/24/20 at 1:30 pm to Chromdome35
From April 12, 2009 to April 10, 2010, CDC estimated there were 60.8 million cases (range: 43.3-89.3 million), 274,304 hospitalizations (range: 195,086-402,719), and 12,469 deaths (range: 8868-18,306) in the United States due to the (H1N1)pdm09 virus.
Could somebody do a graphic to show how bad This pandemic is compared to the H1N1 pandemic?
Is it better?
Worse?
Same?
Could somebody do a graphic to show how bad This pandemic is compared to the H1N1 pandemic?
Is it better?
Worse?
Same?

 Page 60 of 331



Popular

Back to top
 Follow TigerDroppings for LSU Football News