




 0
0





- My Forums
- Tiger Rant
- LSU Recruiting
- SEC Rant
- Saints Talk
- Pelicans Talk
- More Sports Board
- Fantasy Sports
- Golf Board
- Soccer Board
- O-T Lounge
- Tech Board
- Home/Garden Board
- Outdoor Board
- Health/Fitness Board
- Movie/TV Board
- Book Board
- Music Board
- Political Talk
- Money Talk
- Fark Board
- Gaming Board
- Travel Board
- Food/Drink Board
- Ticket Exchange
- TD Help Board
Customize My Forums- View All Forums
- Show Left Links
- Topic Sort Options
- Trending Topics
- Recent Topics
- Active Topics
Started By
Message
re: Daily COVID Updated as of 11/2/20 8:00 PM
Posted on 4/8/20 at 9:07 pm to ApexTiger
Posted on 4/8/20 at 9:07 pm to ApexTiger
I believe that the mortality rate is actually fairly low; however, the current mortality rate is skewed high because there are a lot more cases out there than anyone realizes.
There are two data points that back this theory up.
1) Mortality Rate is much higher than it actually is because the number of cases is constrained by testing while the death rate has no such constraint.
2) The % of test results that are coming back positive has been steadily increasing since 3/16 even though the number of tests given is staying fairly constant.
There are two data points that back this theory up.
1) Mortality Rate is much higher than it actually is because the number of cases is constrained by testing while the death rate has no such constraint.
2) The % of test results that are coming back positive has been steadily increasing since 3/16 even though the number of tests given is staying fairly constant.
This post was edited on 4/8/20 at 9:11 pm
Posted on 4/8/20 at 9:10 pm to Chromdome35
This is the link to the COVID-19 Country tracker that I have shared on Google Drive. Chromdome's COVID-19 Daily Tracker
This is the link to the US state level tracker that I have shared via Google Drive. Chromdome's State Level COVID-19 Daily Tracker
On the state level tracker the states I have available right now are listed below. I will be adding additional states in the coming days.
Arkansas, Louisiana, New York, Georgia, Florida, California
The source for the data is https://www.worldometers.info/coronavirus/
The source for the testing data is from https://covidtracking.com/data/
On the tracker sheet you will see tabs for the following data:
1) US Summary
2) Country Comparables: This shows you how the US stacks up vs. select other countries dealing with COVID-19
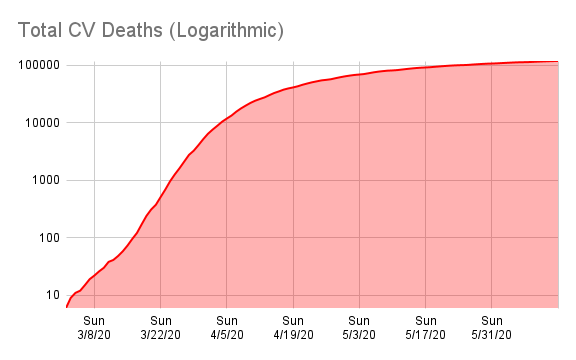
3) Logarithmic Comparisons - Shows the US vs the other countries on the tracker.
4) Covid Vs Other Outbreaks - Compares the current COVID numbers to the last 10 years of flue and H1N1
5) US Weighted Averages - Explores 7 day vs 3 day weight average trends
6) Italy Summary
7) UK Summary
8) France Summary
9) Germany Summary
10) Sweden Summary
11) World Summary
NOTE: The daily growth rate data will not be accurate until the end of the day's postings. It will change throughout the day.
NOTE: I am not tracking individual states, I don't have a reliable consistent source for that data.
NOTE: I am not a mathematician, statistics guru, scientist, sharpest tack in the box, I'm just a guy who likes to understand for myself what is happening and to share it with others. This thread was not created to debate if you should or shouldn't take this seriously, it is simply to present the numbers and foster conversation.
NOTE: I have added a prediction number to the bottom of the data grid. This simply takes the previous days numbers and grows them at the previous day's growth rate. It should give the viewer some idea of what the numbers will look like today. Obviously, the final number for the day will be higher or lower based on what today's growth rate actualy is. This is just a simple indicator.






This is the link to the US state level tracker that I have shared via Google Drive. Chromdome's State Level COVID-19 Daily Tracker
On the state level tracker the states I have available right now are listed below. I will be adding additional states in the coming days.
Arkansas, Louisiana, New York, Georgia, Florida, California
The source for the data is https://www.worldometers.info/coronavirus/
The source for the testing data is from https://covidtracking.com/data/
On the tracker sheet you will see tabs for the following data:
1) US Summary
2) Country Comparables: This shows you how the US stacks up vs. select other countries dealing with COVID-19
3) Logarithmic Comparisons - Shows the US vs the other countries on the tracker.
4) Covid Vs Other Outbreaks - Compares the current COVID numbers to the last 10 years of flue and H1N1
5) US Weighted Averages - Explores 7 day vs 3 day weight average trends
6) Italy Summary
7) UK Summary
8) France Summary
9) Germany Summary
10) Sweden Summary
11) World Summary
NOTE: The daily growth rate data will not be accurate until the end of the day's postings. It will change throughout the day.
NOTE: I am not tracking individual states, I don't have a reliable consistent source for that data.
NOTE: I am not a mathematician, statistics guru, scientist, sharpest tack in the box, I'm just a guy who likes to understand for myself what is happening and to share it with others. This thread was not created to debate if you should or shouldn't take this seriously, it is simply to present the numbers and foster conversation.
NOTE: I have added a prediction number to the bottom of the data grid. This simply takes the previous days numbers and grows them at the previous day's growth rate. It should give the viewer some idea of what the numbers will look like today. Obviously, the final number for the day will be higher or lower based on what today's growth rate actualy is. This is just a simple indicator.
Posted on 4/8/20 at 9:12 pm to Chromdome35
Good job everyone
Posted on 4/8/20 at 9:18 pm to Chromdome35
If you look at the surge in deaths yesterday and move some of those to Sunday & Monday where they belonged, the death curve would look much smoother and today's result would be a reasonable increase over yesterday.
The growth rate for deaths appears to be settling in around 15%. That means a days to double rate of slightly over 6. I hope we start to see some further declining in that number very quickly.
I've been fairly vocal about my theory on the cause of high mortality rate and the testing constraint. I won't subject you to it again.
We are hearing a lot about the availability of testing, but we aren't seeing that reflected in the numbers of testing, they are absolutely hovering in the 130K range. Is it a laboratory bottleneck again as we saw in the emerging phases of the outbreak?
There is an increasing % of tests that are coming back positive, but the numbers of tests given is remaining steady.
The growth rate for deaths appears to be settling in around 15%. That means a days to double rate of slightly over 6. I hope we start to see some further declining in that number very quickly.
I've been fairly vocal about my theory on the cause of high mortality rate and the testing constraint. I won't subject you to it again.
We are hearing a lot about the availability of testing, but we aren't seeing that reflected in the numbers of testing, they are absolutely hovering in the 130K range. Is it a laboratory bottleneck again as we saw in the emerging phases of the outbreak?
There is an increasing % of tests that are coming back positive, but the numbers of tests given is remaining steady.
Posted on 4/8/20 at 9:25 pm to Jrv2damac
I feel good about the COVID19 numbers today.
The continued flat line of confirmed tests continues. We are at the peak and slowly starting to see a drop in confirmed cases.
No major outbreak anywhere in the country, but man this virus really kills the vulnerable.
In California, there are 1,154 in the ICU with COVID19. Most of those will likely die.
I was looking at the death numbers of every state and there only a handful of 400 deaths (MA, WA, IL, CA) and everyone is around 100ish or lower. Then you have NJ (1,504) and NY (6,628). The differene is nuts.
The continued flat line of confirmed tests continues. We are at the peak and slowly starting to see a drop in confirmed cases.
No major outbreak anywhere in the country, but man this virus really kills the vulnerable.
In California, there are 1,154 in the ICU with COVID19. Most of those will likely die.
I was looking at the death numbers of every state and there only a handful of 400 deaths (MA, WA, IL, CA) and everyone is around 100ish or lower. Then you have NJ (1,504) and NY (6,628). The differene is nuts.
Posted on 4/8/20 at 9:27 pm to Chromdome35
Theres plenty of people in here. You don’t have to talk to yourself
Posted on 4/8/20 at 9:30 pm to uppermidwestbama
quote:
I was looking at the death numbers of every state and there only a handful of 400 deaths (MA, WA, IL, CA) and everyone is around 100ish or lower.
Don’t forget about Louisiana’s over 600.
This post was edited on 4/8/20 at 9:33 pm
Posted on 4/8/20 at 9:39 pm to TigerBR1111
California has 14,100 tests pending as of tonight.
Posted on 4/8/20 at 9:41 pm to uppermidwestbama
40.3% the the new COVID19 deaths are from NYC alone. Nationally that is a very good sign.
This post was edited on 4/8/20 at 9:42 pm
Posted on 4/8/20 at 10:11 pm to Chromdome35
Not sure if this was intentional or not, but your numbers of new cases for yesterday do not reflect what’s on worldometer. It did earlier, though.
This post was edited on 4/8/20 at 10:38 pm
Posted on 4/8/20 at 10:13 pm to uppermidwestbama
Well it looks like the nursing home where I work has one positive case currently and 3 pending lab tests.
What is the normal length of duration for plaquinil? I see an order for 5 days only. ??? And no zpack.
This resident is a FUll CODE and a frail little thing.
What is the normal length of duration for plaquinil? I see an order for 5 days only. ??? And no zpack.
This resident is a FUll CODE and a frail little thing.
Posted on 4/8/20 at 10:26 pm to Ingloriousbastard
quote:As the growth in testing has slowed, the percentage of positive tests have increased.
I’m not sure if anyone ever answered, but is it not entirely possible that testing hasn’t increased because symptoms/infections haven’t increased?
On top of that, as the true percentage of infections increases, there will be fewer false positives but more false negatives.
So in order to compensate for the changes in false positives and false negatives, the proportion of positive cases would need to decrease.
For example, let’s assume a test correctly identified 95% of both positive and negative cases and we tested 1000 people.
If the true number of infections (true positives + false negatives) was 100 (10%) we would get 95 true positives (9.5%), 45 false positives (4.5%), and a total of 140 positives (14%). So only 67.9% of the positive cases would be true positives, and the total positives would be 40% greater than the true number of infections.
On the other hand, if the true number of infections was 400 (40%) then we would get 380 true positives (38%), 30 false negatives (3%), and 410 total positives (41%). 92.7% is the positive cases would be true positives, and the total positives would be only 2.5% higher than the true number of infections.
Yet, despite the same number of tests (1000) the accuracy increases significantly as the infection rate increased by a multiple of 4 (10 to 40), but the number of positive tests would only increase by a multiple of 2.93.
Posted on 4/8/20 at 10:35 pm to Ingloriousbastard
where are you seeing numbers for Saturday on the WOM site?
The only way I've found historical numbers is to hover over the points on the graphs. When you do that, you'll see that WOM has updated a bunch of the historical numbers and they don't match what was on their site at the time I recorded it.
That leaves me with a dilemma, do I update all the historical numbers to match the WOM graphs? None of them look materially different.
The only way I've found historical numbers is to hover over the points on the graphs. When you do that, you'll see that WOM has updated a bunch of the historical numbers and they don't match what was on their site at the time I recorded it.
That leaves me with a dilemma, do I update all the historical numbers to match the WOM graphs? None of them look materially different.
Posted on 4/8/20 at 10:39 pm to Chromdome35
Sorry, your numbers for yesterday and Monday are the only ones that appear incorrect. You appear to have taken some from Monday and added them to yesterday’s total.
Your chart now shows that yesterday was the peak. Earlier, I’m 99% sure it showed that it was Saturday, which reflects the source data.
Your chart now shows that yesterday was the peak. Earlier, I’m 99% sure it showed that it was Saturday, which reflects the source data.
This post was edited on 4/8/20 at 10:48 pm
Posted on 4/8/20 at 10:41 pm to buckeye_vol
And on a similar note, with people focusing on serological testing so those who had COVID-19 and (hopefully) developed immunity can more easily get back into society, the same phenomenon holds true.
So the lower the true infection rate, the more problematic, if not outright dangerous, the testing will be. Using the 95% accuracy rates again, if only 10% were actually infected (33.1 million), we’ll get 46.3 million positive tests, but 14.9 million will be false positives (32.2%).
So it’s quite problematic if 14.9 million people believe they had the virus and are immune because the serological test was positive. On top of that, since there would be a a higher portion of positive tests (14%), than true infections (10%) it would appear that we’re closer to herd immunity than we actually are.
So the lower the true infection rate, the more problematic, if not outright dangerous, the testing will be. Using the 95% accuracy rates again, if only 10% were actually infected (33.1 million), we’ll get 46.3 million positive tests, but 14.9 million will be false positives (32.2%).
So it’s quite problematic if 14.9 million people believe they had the virus and are immune because the serological test was positive. On top of that, since there would be a a higher portion of positive tests (14%), than true infections (10%) it would appear that we’re closer to herd immunity than we actually are.
Posted on 4/8/20 at 10:49 pm to Ingloriousbastard
Sorry i'm being a little dense, which date's number is wrong?
I'm looking at WOM and I'm not seeing it, but I stare at numbers so much sometimes they bleed together.
I'm looking at WOM and I'm not seeing it, but I stare at numbers so much sometimes they bleed together.
Posted on 4/8/20 at 10:54 pm to Chromdome35
Worldometer shows Saturday with 34,196, Sunday with 25,316, Monday with 31,107, Tuesday with 33,460, and today with 31,935.
Your numbers for yesterday and Monday appear to have changed (looks like some were taken from Monday and added to yesterday), otherwise your other dates match.
Your numbers for yesterday and Monday appear to have changed (looks like some were taken from Monday and added to yesterday), otherwise your other dates match.
Posted on 4/8/20 at 10:58 pm to uppermidwestbama
quote:
I feel good about the COVID19 numbers today.
I feel good about it in general. Fewer overall deaths in March 2020 than in March 2019. This is a joke.
Posted on 4/8/20 at 11:32 pm to Ingloriousbastard
I believe you, but where are you seeing those numbers on the WOM site? I can't find them.

 Page 153 of 331



Popular

Back to top
 Follow TigerDroppings for LSU Football News