




 3
3







- My Forums
- Tiger Rant
- LSU Recruiting
- SEC Rant
- Saints Talk
- Pelicans Talk
- More Sports Board
- Fantasy Sports
- Golf Board
- Soccer Board
- O-T Lounge
- Tech Board
- Home/Garden Board
- Outdoor Board
- Health/Fitness Board
- Movie/TV Board
- Book Board
- Music Board
- Political Talk
- Money Talk
- Fark Board
- Gaming Board
- Travel Board
- Food/Drink Board
- Ticket Exchange
- TD Help Board
Customize My Forums- View All Forums
- Show Left Links
- Topic Sort Options
- Trending Topics
- Recent Topics
- Active Topics
Started By
Message
re: Daily COVID Updated as of 11/2/20 8:00 PM
Posted on 4/8/20 at 4:41 pm to huskerdawg5
Posted on 4/8/20 at 4:41 pm to huskerdawg5
can we get a moving average on daily new cases?
Posted on 4/8/20 at 4:45 pm to baybeefeetz
Posted on 4/8/20 at 4:48 pm to TigerDoc
Thanks. look like sperm going for that egg.
eta but if the testing constraints is as Chrome says, then it really doesn't matter.
eta but if the testing constraints is as Chrome says, then it really doesn't matter.
This post was edited on 4/8/20 at 4:49 pm
Posted on 4/8/20 at 4:51 pm to baybeefeetz
What time frame do you want to see, 3 or 7 day rolling average?
Do you want a weighted average or just a straight average?
A weighted average puts more emphasis on recent results vs older results.
Do you want a weighted average or just a straight average?
A weighted average puts more emphasis on recent results vs older results.
This post was edited on 4/8/20 at 4:57 pm
Posted on 4/8/20 at 5:02 pm to baybeefeetz
Bay, I added a simple 7 day rolling average new cases per day column to the google sheet.
Posted on 4/8/20 at 5:44 pm to Chromdome35
This is the link to the COVID-19 Country tracker that I have shared on Google Drive. Chromdome's COVID-19 Daily Tracker
This is the link to the US state level tracker that I have shared via Google Drive. Chromdome's State Level COVID-19 Daily Tracker
On the state level tracker the states I have available right now are listed below. I will be adding additional states in the coming days.
Arkansas, Louisiana, New York, Georgia, Florida, California
The source for the data is https://www.worldometers.info/coronavirus/
The source for the testing data is from https://covidtracking.com/data/
On the tracker sheet you will see tabs for the following data:
1) US Summary
2) Country Comparables: This shows you how the US stacks up vs. select other countries dealing with COVID-19
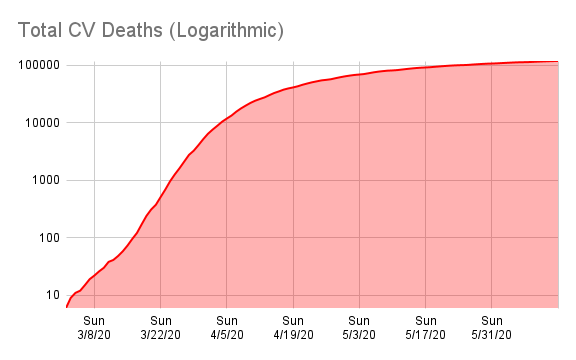
3) Logarithmic Comparisons - Shows the US vs the other countries on the tracker.
4) Covid Vs Other Outbreaks - Compares the current COVID numbers to the last 10 years of flue and H1N1
5) US Weighted Averages - Explores 7 day vs 3 day weight average trends
6) Italy Summary
7) UK Summary
8) France Summary
9) Germany Summary
10) Sweden Summary
11) World Summary
NOTE: The daily growth rate data will not be accurate until the end of the day's postings. It will change throughout the day.
NOTE: I am not tracking individual states, I don't have a reliable consistent source for that data.
NOTE: I am not a mathematician, statistics guru, scientist, sharpest tack in the box, I'm just a guy who likes to understand for myself what is happening and to share it with others. This thread was not created to debate if you should or shouldn't take this seriously, it is simply to present the numbers and foster conversation.
NOTE: I have added a 7 day rolling average column for number of daily cases, it appears on the right side of the Cases columns.






This is the link to the US state level tracker that I have shared via Google Drive. Chromdome's State Level COVID-19 Daily Tracker
On the state level tracker the states I have available right now are listed below. I will be adding additional states in the coming days.
Arkansas, Louisiana, New York, Georgia, Florida, California
The source for the data is https://www.worldometers.info/coronavirus/
The source for the testing data is from https://covidtracking.com/data/
On the tracker sheet you will see tabs for the following data:
1) US Summary
2) Country Comparables: This shows you how the US stacks up vs. select other countries dealing with COVID-19
3) Logarithmic Comparisons - Shows the US vs the other countries on the tracker.
4) Covid Vs Other Outbreaks - Compares the current COVID numbers to the last 10 years of flue and H1N1
5) US Weighted Averages - Explores 7 day vs 3 day weight average trends
6) Italy Summary
7) UK Summary
8) France Summary
9) Germany Summary
10) Sweden Summary
11) World Summary
NOTE: The daily growth rate data will not be accurate until the end of the day's postings. It will change throughout the day.
NOTE: I am not tracking individual states, I don't have a reliable consistent source for that data.
NOTE: I am not a mathematician, statistics guru, scientist, sharpest tack in the box, I'm just a guy who likes to understand for myself what is happening and to share it with others. This thread was not created to debate if you should or shouldn't take this seriously, it is simply to present the numbers and foster conversation.
NOTE: I have added a 7 day rolling average column for number of daily cases, it appears on the right side of the Cases columns.
This post was edited on 4/8/20 at 5:46 pm
Posted on 4/8/20 at 5:47 pm to LSU2ALA
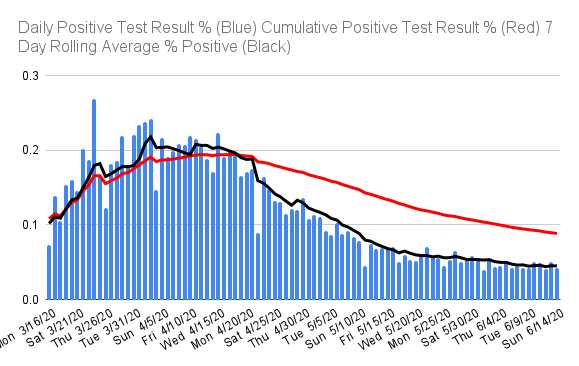
If the virus was spreading you would see an increase in positive cases against the baseline of testing.
This post was edited on 4/8/20 at 5:47 pm
Posted on 4/8/20 at 5:53 pm to Veritas
Like this?
Posted on 4/8/20 at 6:14 pm to Chromdome35
I’m not sure if anyone ever answered, but is it not entirely possible that testing hasn’t increased because symptoms/infections haven’t increased?
Posted on 4/8/20 at 6:29 pm to Ingloriousbastard
Testing availability in my state is wide open these days. Testing numbers yesterday and today dropped off the cliff. Not even 1k tests conducted.
Posted on 4/8/20 at 6:30 pm to Ingloriousbastard
I think that if the number of tests remains flat and the % of positive tests is increasing (as it is) then that would indicate more people are infected.
Posted on 4/8/20 at 6:32 pm to Veritas
Not true. If the severity of the virus was spreading to the point where people needed medical care, you would see an increase in hospitalizations.
Admits are going down fast, same thing with ICU numbers.
You can have 1,000 people get a positive test and zero need for medical care. It's usesless information. If you test 1,000 positive and 50 need to get admitted, then you have a problem.
More testing is available and fewer confirmations are being had.
Admits are going down fast, same thing with ICU numbers.
You can have 1,000 people get a positive test and zero need for medical care. It's usesless information. If you test 1,000 positive and 50 need to get admitted, then you have a problem.
More testing is available and fewer confirmations are being had.
Posted on 4/8/20 at 6:37 pm to TigerDoc
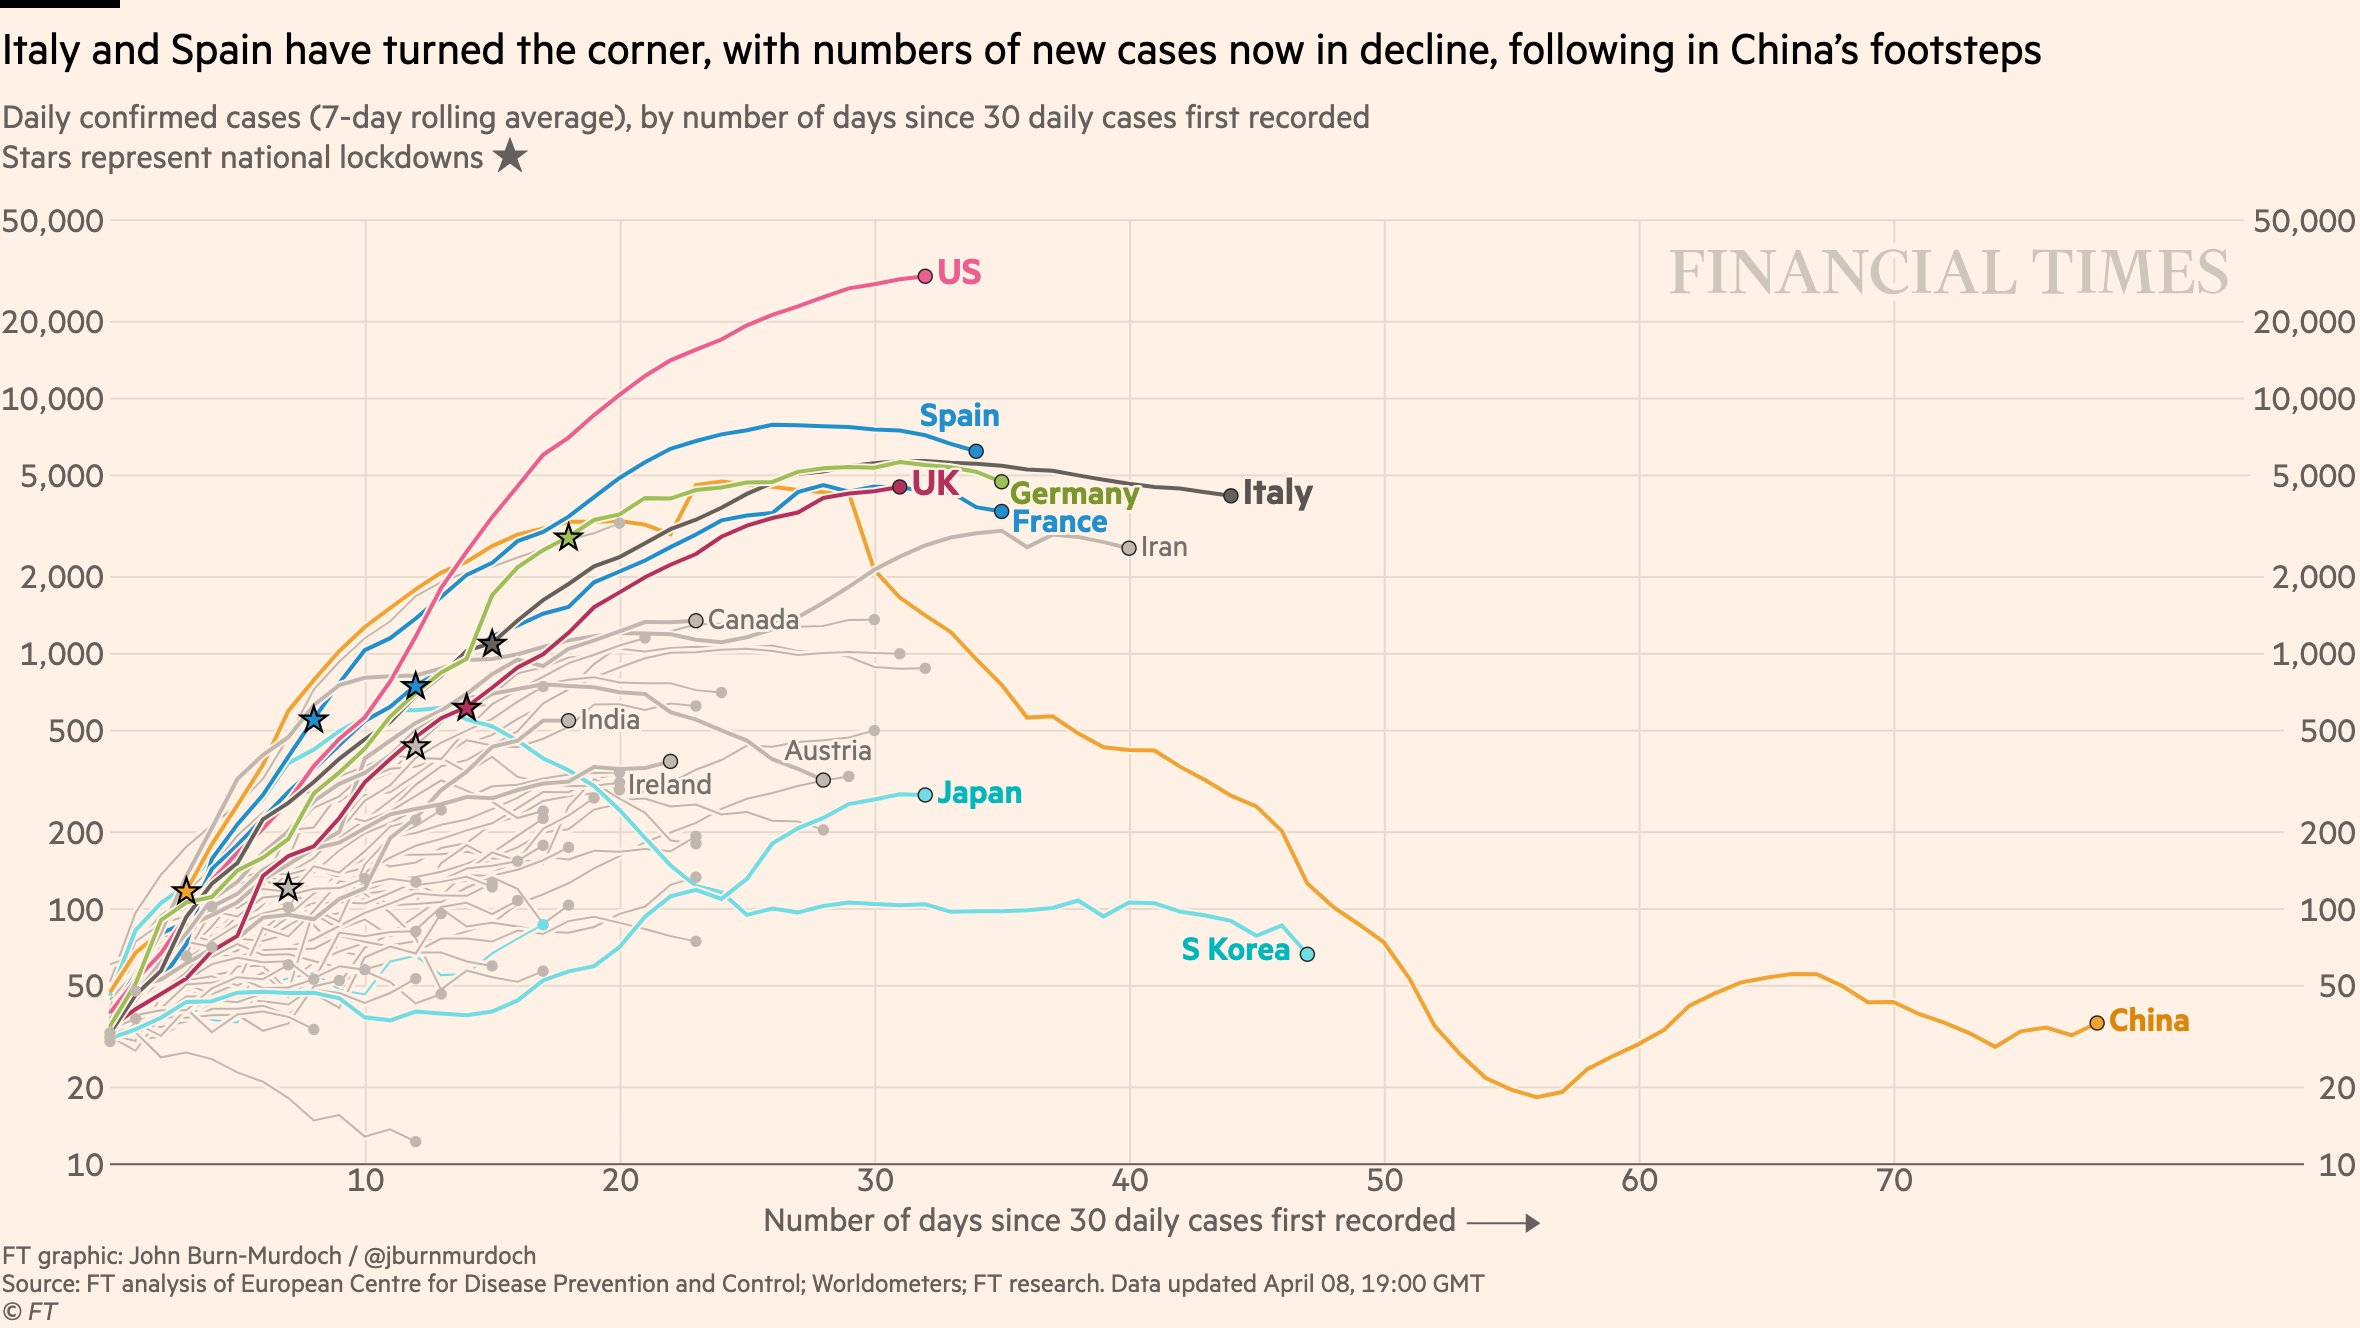
A lot of statisticians don’t like that FT graph
Posted on 4/8/20 at 7:08 pm to uppermidwestbama
just wondering if both could be true..could positive cases continue to rise and hospitalizations continue to decline?
seems like we cant get any real updates on how plaquenil and zpack trials are going, just wondering if thats what it is happening
seems like we cant get any real updates on how plaquenil and zpack trials are going, just wondering if thats what it is happening
Posted on 4/8/20 at 7:19 pm to Chromdome35
Testing availability has only increased in my neck of the woods. Two weeks ago, I’m not sure we had any tests available other than at a hospital or two. Now, we have at least a dozen, probably 2-3 dozen if we include surrounding counties.
If availability of testing is increasing, then cases dropping (or even staying relatively flat) would seem to be a good sign to me. If availability was dropping, I’d agree with you, but this is not the case.
If availability of testing is increasing, then cases dropping (or even staying relatively flat) would seem to be a good sign to me. If availability was dropping, I’d agree with you, but this is not the case.
Posted on 4/8/20 at 7:21 pm to beezy
quote:
true..could positive cases continue to rise and hospitalizations continue to decline?
Yes. Many states have opened testing for people who are asymptomatic that had close contact with a positive case and symptomatic people who were previously denied testing because their symptoms were not severe enough.
This should mean we get more positives that do not need hospitalization.
This post was edited on 4/8/20 at 7:22 pm
Posted on 4/8/20 at 7:37 pm to Ingloriousbastard
quote:
I’m not sure if anyone ever answered, but is it not entirely possible that testing hasn’t increased because symptoms/infections haven’t increased?
My first thought is to doubt that’s the case as there are other illnesses out there and reasons to test that cause the negatives. If the rate of testing stays consistent and the percentage of infection stays consistent then I don’t think we have any idea what we are dealing with.
Posted on 4/8/20 at 8:34 pm to LSU2ALA
Posted on 4/8/20 at 8:43 pm to Jinglebob
quote:
Yes. Many states have opened testing for people who are asymptomatic that had close contact with a positive case and symptomatic people who were previously denied testing because their symptoms were not severe enough
The people is people aren't going to just go in. The public perception of getting tested involves getting a q-tip shoved into your know halfway to your arse. No one is just signing up for that unless they think they need a doctor.
Posted on 4/8/20 at 9:00 pm to Chromdome35
why is the mortality rate 3.43% ?
we have increased testing...
something doesn't add up
we have increased testing...
something doesn't add up

 Page 152 of 331



Popular

Back to top
 Follow TigerDroppings for LSU Football News