




 1
1










- My Forums
- Tiger Rant
- LSU Recruiting
- SEC Rant
- Saints Talk
- Pelicans Talk
- More Sports Board
- Fantasy Sports
- Golf Board
- Soccer Board
- O-T Lounge
- Tech Board
- Home/Garden Board
- Outdoor Board
- Health/Fitness Board
- Movie/TV Board
- Book Board
- Music Board
- Political Talk
- Money Talk
- Fark Board
- Gaming Board
- Travel Board
- Food/Drink Board
- Ticket Exchange
- TD Help Board
Customize My Forums- View All Forums
- Show Left Links
- Topic Sort Options
- Trending Topics
- Recent Topics
- Active Topics
Started By
Message
re: Daily COVID Updated as of 11/2/20 8:00 PM
Posted on 4/8/20 at 11:41 pm to Chromdome35
Posted on 4/8/20 at 11:41 pm to Chromdome35
LINK
In the daily new cases part. I’m not saying you’re wrong, but the data doesn’t match. Wasn’t sure if there was a typo (I work with numbers and have done this plenty of times) or if it was you calculating something in a different way.
I’m 99% sure yesterday’s number was correct on yours at one point, but I may be wrong. It was the fact that yours showed yesterday as the peak that threw me off.
In the daily new cases part. I’m not saying you’re wrong, but the data doesn’t match. Wasn’t sure if there was a typo (I work with numbers and have done this plenty of times) or if it was you calculating something in a different way.
I’m 99% sure yesterday’s number was correct on yours at one point, but I may be wrong. It was the fact that yours showed yesterday as the peak that threw me off.
Posted on 4/9/20 at 1:35 am to buckeye_vol
quote:
As the growth in testing has slowed, the percentage of positive tests have increased.
We have tested 1 million people in the last 6 days.
That is more than the first 9 weeks combined.
We are testing more and more asymptomatic and mildly symptomatic people.
An increase in positive cases isn't necessarily a bad thing.
How does the hospitalization trend look?
The fact that IHME just reduced their predictions for hospitalizations/ICU by 30% and deaths by 20% from 4 days ago says a lot.
This post was edited on 4/9/20 at 1:38 am
Posted on 4/9/20 at 2:17 am to Jinglebob
quote:Yes. But we increased the number of tests given by less than 6% daily over the last week compared to something like 27% daily for the previous 3 weeks.
We have tested 1 million people in the last 6 days.
That is more than the first 9 weeks combined.
Since the slowing of testing growth corresponds to an increase in the positive test percentage, then cases are likely growing more than the testing and we’re identifying fewer cases as a result.
quote:Maybe, but their growth distribution indicates that the model suspects a sharp increase to a sharp peak with a sharp decease that mirrors the increase. It also appears to be extremely sensitive to changes, even when they’re a result of obvious delays in reporting. So it doesn’t appear to account well for measurement error.
The fact that IHME just reduced their predictions for hospitalizations and deaths by 30-50% from 4 days ago says a lot.
In addition, I’ve noticed that the observed distribution of nations who are ahead of us on the curve, often have a flatter peak and their decrease is less rapid than their decrease.
In other words, I think the should have used a “fat tailed” distribution since there appears to be both more skewness and kurtosis.
So I think it underestimated the risk once it detected a slowing, as it assumed it will hit the peak quickly and then quick and smooth sailing on the way back down.
But I think there is decent chance it’s going to a more gradual increase to the peak and an even longer, gradual decrease from there. That would mean that the model is now underestimating the deaths.
Posted on 4/9/20 at 8:36 am to Ingloriousbastard
What is happening is that WoM is revising the number of cases and deaths after the fact.
I'm basing the numbers on my tracker on what the number was at the end of the reporting day. If they revise that number 3 days later, I haven't been reflecting that.
I can go back and update all my numbers, but that's going to make everything in the tracker change a little.
Does anyone know of a reason why I should not do this?
I'm basing the numbers on my tracker on what the number was at the end of the reporting day. If they revise that number 3 days later, I haven't been reflecting that.
I can go back and update all my numbers, but that's going to make everything in the tracker change a little.
Does anyone know of a reason why I should not do this?
Posted on 4/9/20 at 8:41 am to Chromdome35
Fair enough. That’s your call on the methodology you use. I guess the only issue I’d see is that if last Saturday ends up being the true peak in new cases, then your curve is going to look a bit different (since your peak is 3 days later), though I’m sure it won’t be a huge difference for the big picture.
Not trying to nit-pick. I really appreciate this thread.
Not trying to nit-pick. I really appreciate this thread.
Posted on 4/9/20 at 8:44 am to Chromdome35
This is the link to the COVID-19 Country tracker that I have shared on Google Drive. Chromdome's COVID-19 Daily Tracker
This is the link to the US state level tracker that I have shared via Google Drive. Chromdome's State Level COVID-19 Daily Tracker
On the state level tracker the states I have available right now are listed below. I will be adding additional states in the coming days.
Arkansas, Louisiana, New York, Georgia, Florida, California
The source for the data is https://www.worldometers.info/coronavirus/
The source for the testing data is from https://covidtracking.com/data/
On the tracker sheet you will see tabs for the following data:
1) US Summary
2) Country Comparables: This shows you how the US stacks up vs. select other countries dealing with COVID-19
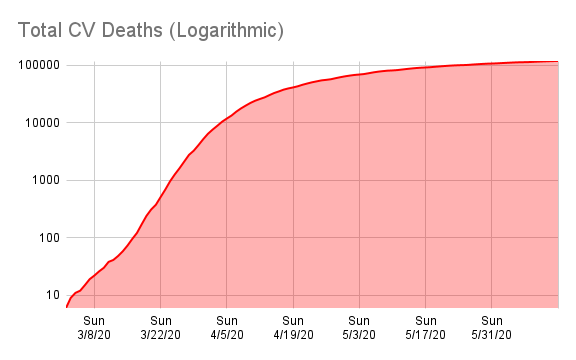
3) Logarithmic Comparisons - Shows the US vs the other countries on the tracker.
4) Covid Vs Other Outbreaks - Compares the current COVID numbers to the last 10 years of flue and H1N1
5) US Weighted Averages - Explores 7 day vs 3 day weight average trends
6) Italy Summary
7) UK Summary
8) France Summary
9) Germany Summary
10) Sweden Summary
11) World Summary
NOTE: The daily growth rate data will not be accurate until the end of the day's postings. It will change throughout the day.
NOTE: I am not tracking individual states, I don't have a reliable consistent source for that data.
NOTE: I am not a mathematician, statistics guru, scientist, sharpest tack in the box, I'm just a guy who likes to understand for myself what is happening and to share it with others. This thread was not created to debate if you should or shouldn't take this seriously, it is simply to present the numbers and foster conversation.
NOTE: I have added a prediction number to the bottom of the data grid. This simply takes the previous days numbers and grows them at the previous day's growth rate. It should give the viewer some idea of what the numbers will look like today. Obviously, the final number for the day will be higher or lower based on what today's growth rate actualy is. This is just a simple indicator.






This is the link to the US state level tracker that I have shared via Google Drive. Chromdome's State Level COVID-19 Daily Tracker
On the state level tracker the states I have available right now are listed below. I will be adding additional states in the coming days.
Arkansas, Louisiana, New York, Georgia, Florida, California
The source for the data is https://www.worldometers.info/coronavirus/
The source for the testing data is from https://covidtracking.com/data/
On the tracker sheet you will see tabs for the following data:
1) US Summary
2) Country Comparables: This shows you how the US stacks up vs. select other countries dealing with COVID-19
3) Logarithmic Comparisons - Shows the US vs the other countries on the tracker.
4) Covid Vs Other Outbreaks - Compares the current COVID numbers to the last 10 years of flue and H1N1
5) US Weighted Averages - Explores 7 day vs 3 day weight average trends
6) Italy Summary
7) UK Summary
8) France Summary
9) Germany Summary
10) Sweden Summary
11) World Summary
NOTE: The daily growth rate data will not be accurate until the end of the day's postings. It will change throughout the day.
NOTE: I am not tracking individual states, I don't have a reliable consistent source for that data.
NOTE: I am not a mathematician, statistics guru, scientist, sharpest tack in the box, I'm just a guy who likes to understand for myself what is happening and to share it with others. This thread was not created to debate if you should or shouldn't take this seriously, it is simply to present the numbers and foster conversation.
NOTE: I have added a prediction number to the bottom of the data grid. This simply takes the previous days numbers and grows them at the previous day's growth rate. It should give the viewer some idea of what the numbers will look like today. Obviously, the final number for the day will be higher or lower based on what today's growth rate actualy is. This is just a simple indicator.
Posted on 4/9/20 at 8:44 am to Chromdome35
quote:
quote:
7.9%

Posted on 4/9/20 at 8:45 am to Ingloriousbastard
Brother, it's all good, I didn't take it as nitpicking at all. I appreciate the heads up on the disparity.
Posted on 4/9/20 at 8:45 am to Chromdome35
chrome they added an entry for US military, are you gonna include that in your count?
Posted on 4/9/20 at 8:46 am to Chromdome35
quote:
Does anyone know of a reason why I should not do this?
Because it would turn into an additional thing you have to do every day. Go back and check historically for changes. I'm sure there are other things you would like to do with your day.
Posted on 4/9/20 at 8:48 am to Winston Cup
I'm really thinking about taking this graph out of my status posts. It is misleading, the growth of new cases isn't slowing, it just looks that way because of the low growth
of testing.
of testing.
Posted on 4/9/20 at 8:50 am to Tiguar
I will certainly consider it, two of my son-in-laws are active duty Military, 1 Army Capt, 1 Marine SSGT
Posted on 4/9/20 at 8:51 am to TigerFanatic99
Your right, and it's a pain in the arse (and slow) to have to hover over every point of a graph to extract the numbers; however, I really want this thing to stay as accurate as possible. I might compromise and do it once a week.
Posted on 4/9/20 at 8:54 am to Chromdome35
quote:
Does anyone know of a reason why I should not do this?
Unless there are major changes happening, then I don’t think there is a real reason to go back given the effort involved. Juice not worth the squeeze.
Posted on 4/9/20 at 9:00 am to Chromdome35
I wouldn't be in a hurry to do it. I am not sure the changes would be significant enough, and some updates might be reversed days later.
Posted on 4/9/20 at 9:03 am to Chromdome35
quote:
the growth of new cases isn't slowing, it just looks that way because of the low growth of testing.
So you're saying there is slow growth in testing and the amount of positives are similar, yet growth isn't slowing? With the slow growth in testing i'm guessing the % of people without symptoms are being tested (and coming back negative) is increasing leading to false low positives?
Posted on 4/9/20 at 9:03 am to Chromdome35
I wouldn’t bother with it.
I was more or less originally pointing out that I thought maybe it was a typo.
I was more or less originally pointing out that I thought maybe it was a typo.
Posted on 4/9/20 at 9:04 am to Tiguar
Tig, I added a status page in my state tracker for the US military. There isn't much data yet, as it matures it will fill in.
Chrome's State COVID Tracker
Chrome's State COVID Tracker
This post was edited on 4/9/20 at 9:06 am
Posted on 4/9/20 at 9:09 am to Chromdome35
neato, thanks
Posted on 4/9/20 at 9:17 am to nerd guy
Nerd,
If you look at the percentage of positive cases, its been growing but shows signs of leveling. If the number of tests is steady and the % of positive results is increasing, then that seems to me to signal an increasing # of infected people. Some of that could be due to false-positive/negatives, but not all of it.
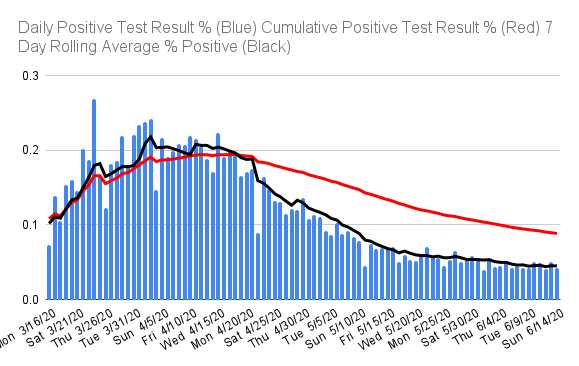
If you look at the percentage of positive cases, its been growing but shows signs of leveling. If the number of tests is steady and the % of positive results is increasing, then that seems to me to signal an increasing # of infected people. Some of that could be due to false-positive/negatives, but not all of it.

 Page 154 of 331



Popular

Back to top
 Follow TigerDroppings for LSU Football News