




 0
0










- My Forums
- Tiger Rant
- LSU Recruiting
- SEC Rant
- Saints Talk
- Pelicans Talk
- More Sports Board
- Fantasy Sports
- Golf Board
- Soccer Board
- O-T Lounge
- Tech Board
- Home/Garden Board
- Outdoor Board
- Health/Fitness Board
- Movie/TV Board
- Book Board
- Music Board
- Political Talk
- Money Talk
- Fark Board
- Gaming Board
- Travel Board
- Food/Drink Board
- Ticket Exchange
- TD Help Board
Customize My Forums- View All Forums
- Show Left Links
- Topic Sort Options
- Trending Topics
- Recent Topics
- Active Topics
Started By
Message
re: Daily COVID Updated as of 11/2/20 8:00 PM
Posted on 4/8/20 at 8:45 am to Ace Midnight
Posted on 4/8/20 at 8:45 am to Ace Midnight
Big day today. LET’S GOOOOO
Posted on 4/8/20 at 8:56 am to Ace Midnight
From your lips...
Let’s see this national fever break.
Feeling good. It’s hump day.
Let’s see this national fever break.
Feeling good. It’s hump day.
Posted on 4/8/20 at 9:03 am to Chromdome35
This is the link to the COVID-19 Country tracker that I have shared on Google Drive. Chromdome's COVID-19 Daily Tracker
This is the link to the US state level tracker that I have shared via Google Drive. Chromdome's State Level COVID-19 Daily Tracker
On the state level tracker the states I have available right now are listed below. I will be adding additional states in the coming days.
Arkansas, Louisiana, New York, Georgia, Florida, California
The source for the data is https://www.worldometers.info/coronavirus/
The source for the testing data is from https://covidtracking.com/data/
On the tracker sheet you will see tabs for the following data:
1) US Summary
2) Country Comparables: This shows you how the US stacks up vs. select other countries dealing with COVID-19
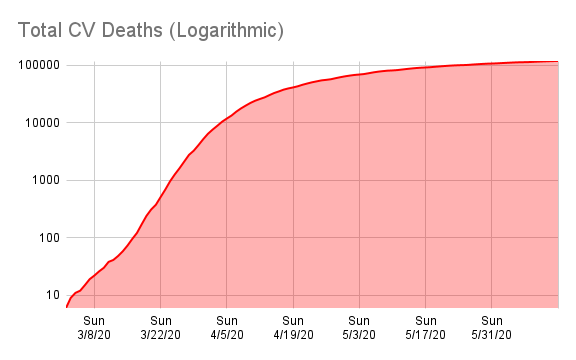
3) Logarithmic Comparisons - Shows the US vs the other countries on the tracker.
4) Covid Vs Other Outbreaks - Compares the current COVID numbers to the last 10 years of flue and H1N1
5) US Weighted Averages - Explores 7 day vs 3 day weight average trends
6) Italy Summary
7) UK Summary
8) France Summary
9) Germany Summary
10) Sweden Summary
11) World Summary
NOTE: The daily growth rate data will not be accurate until the end of the day's postings. It will change throughout the day.
NOTE: I am not tracking individual states, I don't have a reliable consistent source for that data.
NOTE: I am not a mathematician, statistics guru, scientist, sharpest tack in the box, I'm just a guy who likes to understand for myself what is happening and to share it with others. This thread was not created to debate if you should or shouldn't take this seriously, it is simply to present the numbers and foster conversation.
NOTE: I have added a prediction number to the bottom of the data grid. This simply takes the previous days numbers and grows them at the previous day's growth rate. It should give the viewer some idea of what the numbers will look like today. Obviously, the final number for the day will be higher or lower based on what today's growth rate actualy is. This is just a simple indicator.






This is the link to the US state level tracker that I have shared via Google Drive. Chromdome's State Level COVID-19 Daily Tracker
On the state level tracker the states I have available right now are listed below. I will be adding additional states in the coming days.
Arkansas, Louisiana, New York, Georgia, Florida, California
The source for the data is https://www.worldometers.info/coronavirus/
The source for the testing data is from https://covidtracking.com/data/
On the tracker sheet you will see tabs for the following data:
1) US Summary
2) Country Comparables: This shows you how the US stacks up vs. select other countries dealing with COVID-19
3) Logarithmic Comparisons - Shows the US vs the other countries on the tracker.
4) Covid Vs Other Outbreaks - Compares the current COVID numbers to the last 10 years of flue and H1N1
5) US Weighted Averages - Explores 7 day vs 3 day weight average trends
6) Italy Summary
7) UK Summary
8) France Summary
9) Germany Summary
10) Sweden Summary
11) World Summary
NOTE: The daily growth rate data will not be accurate until the end of the day's postings. It will change throughout the day.
NOTE: I am not tracking individual states, I don't have a reliable consistent source for that data.
NOTE: I am not a mathematician, statistics guru, scientist, sharpest tack in the box, I'm just a guy who likes to understand for myself what is happening and to share it with others. This thread was not created to debate if you should or shouldn't take this seriously, it is simply to present the numbers and foster conversation.
NOTE: I have added a prediction number to the bottom of the data grid. This simply takes the previous days numbers and grows them at the previous day's growth rate. It should give the viewer some idea of what the numbers will look like today. Obviously, the final number for the day will be higher or lower based on what today's growth rate actualy is. This is just a simple indicator.
Posted on 4/8/20 at 9:22 am to Chromdome35
35, great thread as always, thank you.
Are these graphs for or agin' us?
tia
Are these graphs for or agin' us?
tia
Posted on 4/8/20 at 10:20 am to Chromdome35
Chrome. Maybe you’re aware of it, but I found another site that provides useful data, visualizations, and metrics that can be selected and changed quite quickly.
Thought you might find some value for your data aggregation and/or might wanted to add it to the resources in your posts.
For example, it provides cases,
fatalities, fatality rate, and recoveries for each state AND county within each state.
Coronavirus.1point3acres
Thought you might find some value for your data aggregation and/or might wanted to add it to the resources in your posts.
For example, it provides cases,
fatalities, fatality rate, and recoveries for each state AND county within each state.
Coronavirus.1point3acres
This post was edited on 4/8/20 at 10:22 am
Posted on 4/8/20 at 12:01 pm to buckeye_vol
Louisiana looking good -- hospitalizations down by 13, vents down by 29, deaths 70 (same as yesterdays number), cases up 746
Posted on 4/8/20 at 12:03 pm to tiger91
Encouraging numbers from Louisiana today. 
Posted on 4/8/20 at 12:10 pm to cusoonkpd
YES and our Governor will still make this stay at home thing until forever 
Posted on 4/8/20 at 1:32 pm to tiger91
We need business leaders to put pressure on him to open things up as soon as guidance from the Feds allows us to
Posted on 4/8/20 at 1:40 pm to wfallstiger
The graphs are neither for us or against us, they are just a reflection of the numbers.
Posted on 4/8/20 at 1:40 pm to buckeye_vol
Thank Buckeye, I will check this site out!
Posted on 4/8/20 at 2:08 pm to tiger91
quote:
hospitalizations down by 13,
quote:
vents down by 29
quote:Could the first two be because of the third stat??
deaths 70
Posted on 4/8/20 at 2:11 pm to LSURussian
Of course. But they’re not being replaced by new hospitalizations.
Posted on 4/8/20 at 2:21 pm to Chromdome35
New York's death count per day still rising, it seems.
Posted on 4/8/20 at 2:25 pm to Eat Your Crow
New York is likely at its peak or within 1-2 days of it
Posted on 4/8/20 at 2:26 pm to Eat Your Crow
quote:
New York's death count per day still rising, it seems.
I get folks are dropping in and out of the topic, but it is well understood (and expected) that deaths will lag the "curve" (new cases). Deaths being reported today (presumably from the past 24, 48 hours) are the result of a new case being identified typically 10 to 15 days ago.
What we want to see (and appear to be seeing, cautiously and optimistically) is a levelling out and then decrease of new cases. Deaths may continue to rise for several days once that happens, but that's how we get out of it - fewer and fewer new cases until the whole thing drops into the background.
Posted on 4/8/20 at 2:27 pm to Eat Your Crow
are we allowing ourselves to view any results (re deaths or new cases) as a positive here? Because seems like last few days have been good in terms of new cases USA wide.
NY and NJ are just a shite show in general. Rest of USA looking good.
NY and NJ are just a shite show in general. Rest of USA looking good.
Posted on 4/8/20 at 2:42 pm to LSURussian
quote:
Could the first two be because of the third stat??
The third stat has been there all along. What's important is the direction we are going in and today is the first day since this thing got started that hospitalizations are lower than the day before. This is consistent with the downward trend in hospitalizations that was identified a few days ago. This continues to be very good news.
Posted on 4/8/20 at 2:54 pm to Chromdome35
This is the link to the COVID-19 Country tracker that I have shared on Google Drive. Chromdome's COVID-19 Daily Tracker
This is the link to the US state level tracker that I have shared via Google Drive. Chromdome's State Level COVID-19 Daily Tracker
On the state level tracker the states I have available right now are listed below. I will be adding additional states in the coming days.
Arkansas, Louisiana, New York, Georgia, Florida, California
The source for the data is https://www.worldometers.info/coronavirus/
The source for the testing data is from https://covidtracking.com/data/
On the tracker sheet you will see tabs for the following data:
1) US Summary
2) Country Comparables: This shows you how the US stacks up vs. select other countries dealing with COVID-19
3) Logarithmic Comparisons - Shows the US vs the other countries on the tracker.
4) Covid Vs Other Outbreaks - Compares the current COVID numbers to the last 10 years of flue and H1N1
5) US Weighted Averages - Explores 7 day vs 3 day weight average trends
6) Italy Summary
7) UK Summary
8) France Summary
9) Germany Summary
10) Sweden Summary
11) World Summary
NOTE: The daily growth rate data will not be accurate until the end of the day's postings. It will change throughout the day.
NOTE: I am not tracking individual states, I don't have a reliable consistent source for that data.
NOTE: I am not a mathematician, statistics guru, scientist, sharpest tack in the box, I'm just a guy who likes to understand for myself what is happening and to share it with others. This thread was not created to debate if you should or shouldn't take this seriously, it is simply to present the numbers and foster conversation.
NOTE: I have added a prediction number to the bottom of the data grid. This simply takes the previous days numbers and grows them at the previous day's growth rate. It should give the viewer some idea of what the numbers will look like today. Obviously, the final number for the day will be higher or lower based on what today's growth rate actualy is. This is just a simple indicator.

This is the link to the US state level tracker that I have shared via Google Drive. Chromdome's State Level COVID-19 Daily Tracker
On the state level tracker the states I have available right now are listed below. I will be adding additional states in the coming days.
Arkansas, Louisiana, New York, Georgia, Florida, California
The source for the data is https://www.worldometers.info/coronavirus/
The source for the testing data is from https://covidtracking.com/data/
On the tracker sheet you will see tabs for the following data:
1) US Summary
2) Country Comparables: This shows you how the US stacks up vs. select other countries dealing with COVID-19
3) Logarithmic Comparisons - Shows the US vs the other countries on the tracker.
4) Covid Vs Other Outbreaks - Compares the current COVID numbers to the last 10 years of flue and H1N1
5) US Weighted Averages - Explores 7 day vs 3 day weight average trends
6) Italy Summary
7) UK Summary
8) France Summary
9) Germany Summary
10) Sweden Summary
11) World Summary
NOTE: The daily growth rate data will not be accurate until the end of the day's postings. It will change throughout the day.
NOTE: I am not tracking individual states, I don't have a reliable consistent source for that data.
NOTE: I am not a mathematician, statistics guru, scientist, sharpest tack in the box, I'm just a guy who likes to understand for myself what is happening and to share it with others. This thread was not created to debate if you should or shouldn't take this seriously, it is simply to present the numbers and foster conversation.
NOTE: I have added a prediction number to the bottom of the data grid. This simply takes the previous days numbers and grows them at the previous day's growth rate. It should give the viewer some idea of what the numbers will look like today. Obviously, the final number for the day will be higher or lower based on what today's growth rate actualy is. This is just a simple indicator.
Posted on 4/8/20 at 3:02 pm to Chromdome35
Where can you find out how many tests are being run daily? I’ve seen some numbers bandied about, but I’d like something that shows official test processed in the US each day. I’m just worried if the number of processed tests is not increasing then we really cannot make any assumptions about being near a peak with regards to the growth rate of positive tests.

 Page 150 of 331



Popular

Back to top
 Follow TigerDroppings for LSU Football News