- My Forums
- Tiger Rant
- LSU Recruiting
- SEC Rant
- Saints Talk
- Pelicans Talk
- More Sports Board
- Fantasy Sports
- Golf Board
- Soccer Board
- O-T Lounge
- Tech Board
- Home/Garden Board
- Outdoor Board
- Health/Fitness Board
- Movie/TV Board
- Book Board
- Music Board
- Political Talk
- Money Talk
- Fark Board
- Gaming Board
- Travel Board
- Food/Drink Board
- Ticket Exchange
- TD Help Board
Customize My Forums- View All Forums
- Show Left Links
- Topic Sort Options
- Trending Topics
- Recent Topics
- Active Topics
Started By
Message
re: Daily COVID Updated as of 11/2/20 8:00 PM
Posted on 4/1/20 at 1:39 pm to Spaceman Spiff
Posted on 4/1/20 at 1:39 pm to Spaceman Spiff
Morons that think doctors treat patients in the streets instead of inside the hospital.
 0
0


Posted on 4/1/20 at 1:50 pm to Ace Midnight
quote:
The initial stumble on getting the test done AND then no ability to scale up was a bad way to start (like having your battleships lined up all nice and pretty to make it easy on the strike force sent to eliminate them) - but it is not how you start, it is how you finish.
Yep. South Korea managed to get it done right. Kudos to them.
I wonder if it wasn't all their testing regime. I wonder if they've got more trust in public health authorities than we do. We've got a lot of potential for failing to suppress this between the infosphere being what it is and congress likely botching the economic relief aspect of this.
This post was edited on 4/1/20 at 1:55 pm
Posted on 4/1/20 at 1:59 pm to Chromdome35
This is the link to the COVID-19 tracker that I have shared on Google Drive. Chromdome's COVID-19 Daily Tracker
The source for the data is https://www.worldometers.info/coronavirus/
The source for the testing data is from https://covidtracking.com/data/
On the tracker sheet you will see tabs for the following data:
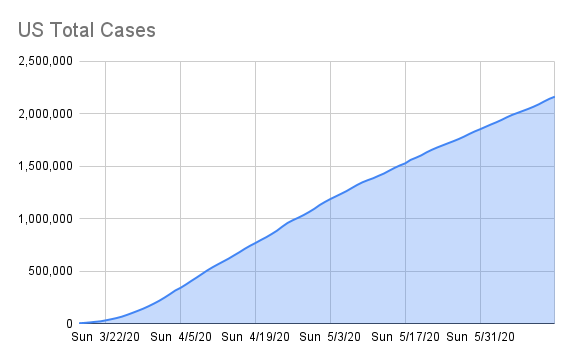
1) US Summary
2) Country Comparables: This shows you how the US stacks up vs. select other countries dealing with COVID-19
3) Logarithmic Comparisons - Shows the US vs the other countries on the tracker.
4) Covid Vs Other Outbreaks - Compares the current COVID numbers to the last 10 years of flue and H1N1
5) US Weighted Averages - Explores 7 day vs 3 day weight average trends
6) Italy Summary
7) UK Summary
8) France Summary
9) Germany Summary
10) Sweden Summary
11) World Summary
NOTE: The daily growth rate data will not be accurate until the end of the day's postings. It will change throughout the day.
NOTE: I am not tracking individual states, I don't have a reliable consistent source for that data.
NOTE: I am not a mathematician, statistics guru, scientist, sharpest tack in the box, I'm just a guy who likes to understand for myself what is happening and to share it with others. This thread was not created to debate if you should or shouldn't take this seriously, it is simply to present the numbers and foster conversation.


The source for the data is https://www.worldometers.info/coronavirus/
The source for the testing data is from https://covidtracking.com/data/
On the tracker sheet you will see tabs for the following data:
1) US Summary
2) Country Comparables: This shows you how the US stacks up vs. select other countries dealing with COVID-19
3) Logarithmic Comparisons - Shows the US vs the other countries on the tracker.
4) Covid Vs Other Outbreaks - Compares the current COVID numbers to the last 10 years of flue and H1N1
5) US Weighted Averages - Explores 7 day vs 3 day weight average trends
6) Italy Summary
7) UK Summary
8) France Summary
9) Germany Summary
10) Sweden Summary
11) World Summary
NOTE: The daily growth rate data will not be accurate until the end of the day's postings. It will change throughout the day.
NOTE: I am not tracking individual states, I don't have a reliable consistent source for that data.
NOTE: I am not a mathematician, statistics guru, scientist, sharpest tack in the box, I'm just a guy who likes to understand for myself what is happening and to share it with others. This thread was not created to debate if you should or shouldn't take this seriously, it is simply to present the numbers and foster conversation.
Posted on 4/1/20 at 2:02 pm to Chromdome35
CHrome I lost the link to the state one .. can you point me in the right direction? Thanks!
Posted on 4/1/20 at 2:05 pm to tiger91
State Tracker
I'm still in the early stages of standing this up. It's taking more time and effort than I anticipated.
I'm still in the early stages of standing this up. It's taking more time and effort than I anticipated.
Posted on 4/1/20 at 2:07 pm to Chromdome35
Thanks for the link and don't kill yourself on this aspect ... I think that we all need to chip in and buy you a drink!! Or 100!!!
FWIW Louisiana, we're told, only puts numbers out on noon each day .. not sure about the weekends though.
FWIW Louisiana, we're told, only puts numbers out on noon each day .. not sure about the weekends though.
This post was edited on 4/1/20 at 2:08 pm
Posted on 4/1/20 at 2:18 pm to Chromdome35
Call me crazy but I'm liking the looks of some of those graphs

Posted on 4/1/20 at 2:22 pm to Chromdome35
quote:
I'm still in the early stages of standing this up. It's taking more time and effort than I anticipated.
I believe in you! I always have.
If you can't do it, the rest of us are certainly way too lazy/incompetent/some combination to do it.
No pressure.
Posted on 4/1/20 at 2:34 pm to Ace Midnight
I have Louisiana, NY, Georgia, and Florida up. I'm getting ready to add Arkansas, Any particular state you all want next?
This post was edited on 4/1/20 at 2:36 pm
Posted on 4/1/20 at 2:37 pm to Chromdome35
If it was me, I would do WA (as reference as much as anything), NJ, CT, MI, IL and TX as next up.
Posted on 4/1/20 at 2:37 pm to Fun Bunch
quote:
Call me crazy but I'm liking the looks of some of those graphs
Not calling you crazy but which graphs are you liking the looks of? I want to feel optimistic.
Posted on 4/1/20 at 2:43 pm to Ace Midnight
Don't know if anyone has posted this, but there is a website done by IHME that tracks all this shite and creates graphs that project deaths based on current known data. You can break it down by state and it predicts when the "apex" of the curve will hit each state (as well as America as a whole). They also predict hospital bed shortages and ventilator shortages. They keep updating it as new data comes in.
It is ran by University of Washington and manned by both medical doctors and PhD mathematicians. So it's legit.
IHME Covid-19
Right now they project the apex of the curve to hit on April, 16th for the U.S. as a whole. They project 93,000 deaths by August.
For Louisiana they predict the peak curve in 10 days. They predict 1,934 deaths by August 4th.
Again they update it daily as new data comes in, so the curves might change slightly day to day.

Posted on 4/1/20 at 2:43 pm to AUstar
quote:
It is ran by University of Washington and manned by both medical doctors and PhD mathematicians. So it's legit.
It’s probably better for the country than the individual states. It’s pretty sketchy with small data.
Posted on 4/1/20 at 2:45 pm to AUstar
AUStar, yes, someone posted it a few days ago. I look at that site daily.
Posted on 4/1/20 at 2:47 pm to Chromdome35
I suspect we might hit 1K deaths today, its mid-afternoon and we're already at 604 deaths for the day, if not today, then tomorrow.
Posted on 4/1/20 at 2:50 pm to Chromdome35
Lets hope the trend continues with the decrease in daily growth rate, new cases and death.
Posted on 4/1/20 at 3:13 pm to Chromdome35
Chicken needs to institute the PT Gold Medal for services to the board to pin to the User Profile.
Chromdome35 deserves the first one.
Chromdome35 deserves the first one.

Posted on 4/1/20 at 3:25 pm to AUstar
The Washington model is off on some states.
Tennessee has 200 hospitalizations but their model says over 1,200 on April 1st. Something is fricky
Tennessee has 200 hospitalizations but their model says over 1,200 on April 1st. Something is fricky
Posted on 4/1/20 at 3:41 pm to AUstar
But that link for Louisiana is "predicting" that the need for vents TODAY is almost twice what we have in vents currently per the LDH website.
To me its not even close to todays stats when compared to the LDH (which I realize could be off but by double the number of vents??).
To me its not even close to todays stats when compared to the LDH (which I realize could be off but by double the number of vents??).

Posted on 4/1/20 at 3:45 pm to TigerCoon
He got my vote. Not only a scholar but also a gentleman.

 Page 116 of 331

Popular
Back to top