





 1
1






- My Forums
- Tiger Rant
- LSU Recruiting
- SEC Rant
- Saints Talk
- Pelicans Talk
- More Sports Board
- Fantasy Sports
- Golf Board
- Soccer Board
- O-T Lounge
- Tech Board
- Home/Garden Board
- Outdoor Board
- Health/Fitness Board
- Movie/TV Board
- Book Board
- Music Board
- Political Talk
- Money Talk
- Fark Board
- Gaming Board
- Travel Board
- Food/Drink Board
- Ticket Exchange
- TD Help Board
Customize My Forums- View All Forums
- Show Left Links
- Topic Sort Options
- Trending Topics
- Recent Topics
- Active Topics
Started By
Message
Posted on 3/30/20 at 12:45 pm to the808bass
quote:
I think patients are no longer contagious around day 10.
I read somewhere these patients shed RNA chunks for quite a few days after but it's not infectious, so thats why they test positive off and on
Posted on 3/30/20 at 1:06 pm to Tiguar
quote:NJ reporting just over 3300 new cases and 37 new deaths.
New York is in and we're at ~8500. NJ, MI, PA, GA, MA are not yet.
Posted on 3/30/20 at 1:07 pm to mmcgrath
quote:PA came in with 668....the exact number they had yesterday too.
NJ reporting just over 3300 new cases and 37 new deaths.
If they end the day at 668, I'm going to venture a guess 668 is their testing capacity or something else is limiting reporting.
Posted on 3/30/20 at 1:15 pm to Chromdome35
Yesterday's deaths lowered down to 363 now.
Posted on 3/30/20 at 1:18 pm to Tiguar
quote:Lab results from some of the private labs are taking up to 7 days. Unfortunately that means there are a ton of positive numbers that have not been reported.
PA came in with 668....the exact number they had yesterday too.
If they end the day at 668, I'm going to venture a guess 668 is their testing capacity or something else is limiting reporting.
Posted on 3/30/20 at 1:20 pm to Tiguar
PA numbers.
4,087 positives
363 hospitalizations (those will lag positives, especially recent positives)
38 deaths
They’ve completed over 37,000 tests
4,087 positives
363 hospitalizations (those will lag positives, especially recent positives)
38 deaths
They’ve completed over 37,000 tests
Posted on 3/30/20 at 1:20 pm to mmcgrath
quote:
Lab results from some of the private labs are taking up to 7 days. Unfortunately that means there are a ton of positive numbers that have not been reported.
lol.
Posted on 3/30/20 at 1:24 pm to the808bass
Anyone know where I can find data/graph for New York State hospitalizations/day? TIA.
Posted on 3/30/20 at 1:24 pm to Kingpenm3
Today's numbers show that only 7.8% of the new test are coming back positive.
Only 21 more hospitalizations.
That's a bunch of good news.
What computers don't seem to have programmed in is the concept of "low hanging fruit". Some people, for what ever reason are more likely to get the disease. So there is some metric that says that ever new exposure is less likely to become a carrier.
eta: LINK
Only 21 more hospitalizations.
That's a bunch of good news.
What computers don't seem to have programmed in is the concept of "low hanging fruit". Some people, for what ever reason are more likely to get the disease. So there is some metric that says that ever new exposure is less likely to become a carrier.
eta: LINK
Posted on 3/30/20 at 1:25 pm to Chicken
Chicken, the table at the top of my posts is static (it doesn't update when I update the underlying data, I have to do a screenshot and post it as an image). Therefore I only update it a few times a day. The data in the linked google sheet always matches.
Posted on 3/30/20 at 1:32 pm to Chicken
Chicken, you should probably just hire CD35 as the official stat tracker for TD.com. Give him admin privileges (once he passes the background check, of course) at least, to keep jackholes from fouling (fowling?) up these sorts of threads.
Posted on 3/30/20 at 1:34 pm to Chromdome35
This is the link to the COVID-19 tracker that I have shared on Google Drive. Chromdome's COVID-19 Daily Tracker
The source for the data is https://www.worldometers.info/coronavirus/
The source for the testing data is from https://covidtracking.com/data/
On the tracker sheet you will see tabs for the following data:
1) US Summary
2) Country Comparables: This shows you how the US stacks up vs. select other countries dealing with COVID-19
3) Logarithmic Comparisons - Shows the US vs the other countries on the tracker.
4) Covid Vs Other Outbreaks - Compares the current COVID numbers to the last 10 years of flue and H1N1
5) US Weighted Averages - Explores 7 day vs 3 day weight average trends
6) Italy Summary
7) UK Summary
8) France Summary
9) Germany Summary
10) Sweden Summary
11) World Summary
NOTE: The daily growth rate data will not be accurate until the end of the day's postings. It will change throughout the day.
NOTE: I am not tracking individual states, I don't have a reliable consistent source for that data.
NOTE: I am not a mathematician, statistics guru, scientist, sharpest tack in the box, I'm just a guy who likes to understand for myself what is happening and to share it with others. This thread was not created to debate if you should or shouldn't take this seriously, it is simply to present the numbers and foster conversation.
I changed the formating of the numbers in the table to reflect positive movements (Green) vs negative movements (Red). This will allow you to quickly see how the numbers are moving.

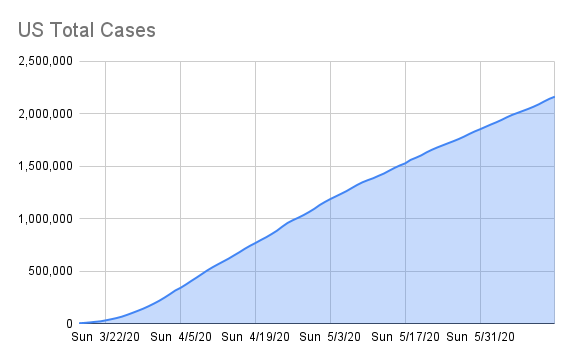



The source for the data is https://www.worldometers.info/coronavirus/
The source for the testing data is from https://covidtracking.com/data/
On the tracker sheet you will see tabs for the following data:
1) US Summary
2) Country Comparables: This shows you how the US stacks up vs. select other countries dealing with COVID-19
3) Logarithmic Comparisons - Shows the US vs the other countries on the tracker.
4) Covid Vs Other Outbreaks - Compares the current COVID numbers to the last 10 years of flue and H1N1
5) US Weighted Averages - Explores 7 day vs 3 day weight average trends
6) Italy Summary
7) UK Summary
8) France Summary
9) Germany Summary
10) Sweden Summary
11) World Summary
NOTE: The daily growth rate data will not be accurate until the end of the day's postings. It will change throughout the day.
NOTE: I am not tracking individual states, I don't have a reliable consistent source for that data.
NOTE: I am not a mathematician, statistics guru, scientist, sharpest tack in the box, I'm just a guy who likes to understand for myself what is happening and to share it with others. This thread was not created to debate if you should or shouldn't take this seriously, it is simply to present the numbers and foster conversation.
I changed the formating of the numbers in the table to reflect positive movements (Green) vs negative movements (Red). This will allow you to quickly see how the numbers are moving.
Posted on 3/30/20 at 1:37 pm to the808bass
quote:I don't know why you would laugh at that Quest Diagnostics is going to catch some heat if they don't catch up. They were reportedly at a max test capacity of 25k / day a few days ago, but they have been picking up specimens from half of the hospitals and doctors in the country. They are less than 2 weeks into private testing but already have a 7 day backlog. Individual hospitals that do their own testing can get the results the next day.
lol
Posted on 3/30/20 at 1:58 pm to mmcgrath
The growth rate of new cases is dropping a lot over the last two weeks and if you took out the NCY death numbers, the death rate is dropping too.
Over the next month it's going to come down to how well Florida, Texas, Chicago, New Orleans, California and Maryland/VA do to slow down the spread or keep it in control.
California is at a key moment these next two weeks. Temps are in the 60's and 70's for many days to come and that will help. They have only had 6,424 confirmed casses with only 133 deaths.
That is a 2 percent date rate.
If California gets out of this next week without a huge spike in numbers I bet we will not see a massive growth out west since Washington has things under control.
Over the next month it's going to come down to how well Florida, Texas, Chicago, New Orleans, California and Maryland/VA do to slow down the spread or keep it in control.
California is at a key moment these next two weeks. Temps are in the 60's and 70's for many days to come and that will help. They have only had 6,424 confirmed casses with only 133 deaths.
That is a 2 percent date rate.
If California gets out of this next week without a huge spike in numbers I bet we will not see a massive growth out west since Washington has things under control.
Posted on 3/30/20 at 2:21 pm to Chromdome35
I'm noticing deaths are lagging for a few reasons.
one has already been discussed but another is they are straight up slow to report
news agencies said 6 died at EAMC in Opelika, AL on Sunday but the ADPH website has not yet updated with those deaths, so they wont be on this worldometers site. That might explain why you see a seemingly random 500 death spike. I guess we can expect spikes like that all throughout this debacle
one has already been discussed but another is they are straight up slow to report
news agencies said 6 died at EAMC in Opelika, AL on Sunday but the ADPH website has not yet updated with those deaths, so they wont be on this worldometers site. That might explain why you see a seemingly random 500 death spike. I guess we can expect spikes like that all throughout this debacle
This post was edited on 3/30/20 at 2:22 pm
Posted on 3/30/20 at 2:43 pm to Tiguar
Missouri reports each day at around 3 PM. I wonder if other states are similar.
Posted on 3/30/20 at 2:57 pm to the808bass
Numbers starting to climb for the day, Today looks like it will end higher than yesterday for raw number of cases and deaths...will the growth %'s be down?
Posted on 3/30/20 at 2:59 pm to the808bass
I suspect because of the lag, the cases per day are being increased retrospectively and have been for a while. So a 3pm cutout is reasonable since they are possibly getting results from testing spread back over 2 weeks. (Look at the log graph with overlay of daily positive tests to daily deaths. The columns had been side by side if you look a week back, now the blue graph is higher because they have been adding to the daily totals).
Now, once Abbott’s point of testing, results in 5 minutes starts to get more use, the daily numbers will be more meaningful for real time estimates
Now, once Abbott’s point of testing, results in 5 minutes starts to get more use, the daily numbers will be more meaningful for real time estimates
Posted on 3/30/20 at 3:06 pm to NorCali
quote:
So a 3pm cutout is reasonable since they are possibly getting results from testing spread back over 2 weeks.
Turnaround here in MO has been 24 hrs-ish. All the people I know who’ve been tested are getting results before 48 hrs.
Probably partly due to our smaller total numbers. But the vast majority of tests are being handled by private labs. They only have the breakdown of private labs versus state for positive tests. But it looks like 80%+ of positive tests are coming from private labs. I would assume that’s mostly representative of the whole.
This post was edited on 3/30/20 at 3:09 pm

 Page 101 of 331



Popular

Back to top
 Follow TigerDroppings for LSU Football News