- My Forums
- Tiger Rant
- LSU Recruiting
- SEC Rant
- Saints Talk
- Pelicans Talk
- More Sports Board
- Fantasy Sports
- Golf Board
- Soccer Board
- O-T Lounge
- Tech Board
- Home/Garden Board
- Outdoor Board
- Health/Fitness Board
- Movie/TV Board
- Book Board
- Music Board
- Political Talk
- Money Talk
- Fark Board
- Gaming Board
- Travel Board
- Food/Drink Board
- Ticket Exchange
- TD Help Board
Customize My Forums- View All Forums
- Show Left Links
- Topic Sort Options
- Trending Topics
- Recent Topics
- Active Topics
Started By
Message
re: Daily COVID Updated as of 11/2/20 8:00 PM
Posted on 3/26/20 at 9:12 pm to Chromdome35
Posted on 3/26/20 at 9:12 pm to Chromdome35
Those graphs look very, very bad for the coming week.
At our hospitals, we're seeing a relatively stable number of new cases a day, but more recently the new admissions are more likely to go directly to the ICU. We have a lot of capacity, but our models say at current rates we'll be near capacity by the end of next week.
At our hospitals, we're seeing a relatively stable number of new cases a day, but more recently the new admissions are more likely to go directly to the ICU. We have a lot of capacity, but our models say at current rates we'll be near capacity by the end of next week.
 2
2


Posted on 3/26/20 at 9:21 pm to BamaAtl
quote:How is the ventilator supply at your hospital system?
At our hospitals, we're seeing a relatively stable number of new cases a day, but more recently the new admissions are more likely to go directly to the ICU. We have a lot of capacity, but our models say at current rates we'll be near capacity by the end of next week.
Posted on 3/26/20 at 9:41 pm to TeLeFaWx
I’m so glad I don’t have to know how to do this 
Thank you all.
Thank you all.
Posted on 3/26/20 at 9:53 pm to Chromdome35
This is the link to the COVID-19 tracker that I have shared on Google Drive. Chromdome's COVID-19 Daily Tracker
The source for the data is https://www.worldometers.info/coronavirus/
The source for the testing data is from https://covidtracking.com/data/
On the tracker sheet you will see tabs for the following data:
1) US Summary
2) Country Comparables: This shows you how the US stacks up vs. select other countries dealing with COVID-19
3) Italy Summary
4) UK Summary
5) France Summary
6) Germany Summary
7) US Weighted Averages - Explores 7 day vs 3 day weight average trends
8) Predictive Model - A simple predictive model that shows where the numbers will be in the future if growth rates don't change
New Tabs Added in the last day
9) Logarithmic Comparisons - Shows the US vs the other countries on the tracker.
10) Sweden Summary
If you would like a graph created that I don't have, just ask and if it's possible I will create it for you.
Due to space constraints on the PT board, I'm only posting a few graphs in the thread, if a consensus emerges of what graphs the PT wants to see in thread without having to go to the tracker, I will gladly change them up.
I am working to create a sheet that compares the US metrics to the other country's metrics. I'll let you all know when that's done and available.
NOTE: The daily growth rate data will not be accurate until the end of the day's postings. It will change throughout the day.
NOTE: I am not tracking individual states, I don't have a reliable consistent source for that data.
NOTE: I am not a mathematician, statistics guru, scientist, sharpest tack in the box, I'm just a guy who likes to understand for myself what is happening and to share it with others. This thread was not created to debate if you should or shouldn't take this seriously, it is simply to present the numbers and foster conversation.
Posted on 3/26/20 at 9:59 pm to Chromdome35
With the increases in testing, we could anticipate the number of cases going up, it did. The downward trend in the Daily Growth of New cases ended today.
Deaths rose by 268 to 1295, and for the 5th day in a row the growth rate of deaths is exceeding the growth rate of new cases and the growth rate of testing.
Looking at the Logarithmic Growth Rate graph for testing, you can see that it appears to be flattening some, anyone know what the daily testing capacity is for the US?
The Mortality rate continued to increase for the fourth day in a row.
The good news, the number of recoveries rose sharply today
This post was edited on 3/26/20 at 10:00 pm
Posted on 3/26/20 at 10:13 pm to Chromdome35
are recoveries being underreported

Posted on 3/26/20 at 10:15 pm to Chromdome35
quote:
The Mortality rate continued to increase for the fourth day in a row.
It will likely move up sharply (relatively) over the next five days.
Posted on 3/26/20 at 10:15 pm to HailHailtoMichigan!
More than likely they are, but who knows.
Posted on 3/26/20 at 10:24 pm to the808bass
Sharply to what?
Posted on 3/26/20 at 10:25 pm to Chromdome35
At this point, out of every 1 million Americans
258 have tested positive
4 of those have died
5 or 6 of those have recovered
6 or 7 of those have a serious case
241 to 243 of those remaining are not considered serious cases
999,742 have either tested negative or have not been tested
258 have tested positive
4 of those have died
5 or 6 of those have recovered
6 or 7 of those have a serious case
241 to 243 of those remaining are not considered serious cases
999,742 have either tested negative or have not been tested
This post was edited on 3/26/20 at 10:30 pm

Posted on 3/26/20 at 11:29 pm to Chromdome35
Mother fricker
frick this shite
frick this shite
Posted on 3/26/20 at 11:44 pm to TeLeFaWx
quote:
Most trends say we are 11 days behind Italy. Even if we were relatively aggressive with containment and social distancing, that might only shift the trend a day or two. Which means we should see a flattening around the 29th or 30th best case.
The data bears that out as well - Italy's Index Case was confirmed on January 31st, our ours was on February 21st. So one could look at the logarithmic graph that Chrome put up for Italy, and go back around 3 weeks ago to see where their curve was, and it's pretty much where ours is right now.....
Posted on 3/27/20 at 12:32 am to ConwayGamecock
Is the assumption that the lockdowns that have been implemented are going to cause the curve to flatten?
Italy implemented a very strict lockdown as opposed to what looks to be a somewhat softer lockdown in some areas of the US.
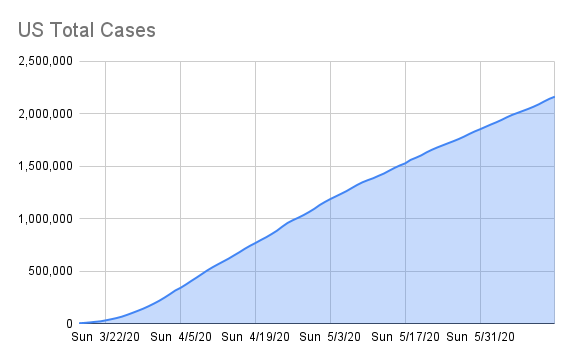
I've been asking this now for a couple of days, when will we see our efforts beginning to show in the numbers? At our current growth rates we'll hit 1M cases in around 10-11 days and 35K dead in 13-14 days if the curve doesn't change. I feel the 35K number is significant due to it being very close to the 34K of Flu deaths the CDC estimates for the 2018-2019 flu year.
We are running out of runway...
Italy implemented a very strict lockdown as opposed to what looks to be a somewhat softer lockdown in some areas of the US.
I've been asking this now for a couple of days, when will we see our efforts beginning to show in the numbers? At our current growth rates we'll hit 1M cases in around 10-11 days and 35K dead in 13-14 days if the curve doesn't change. I feel the 35K number is significant due to it being very close to the 34K of Flu deaths the CDC estimates for the 2018-2019 flu year.
We are running out of runway...
Posted on 3/27/20 at 12:38 am to Chromdome35
Most states and cities have only enacted lockdowns in the last 6 or 7 days.
We won’t see any evidence of a flattening for at least another week, likely more.
We won’t see any evidence of a flattening for at least another week, likely more.
Posted on 3/27/20 at 1:39 am to Chromdome35
I am looking at the last 3 days bar graphs, and it appears that new cases are increasing daily, in The U.S. by about 28%, but deaths are only increasing by about 15% daily. That seems really good.
We really don't have a way to say for certain, how many are recovering, because many people don't have severe symptoms, therefore they go untested. They had it, thought it was a cold, and got over it.
We really don't have a way to say for certain, how many are recovering, because many people don't have severe symptoms, therefore they go untested. They had it, thought it was a cold, and got over it.
Posted on 3/27/20 at 1:48 am to auggie
Auggie, which graph are you looking at exactly?
For the last 3 days, the new case growth rates have been 24.4%, 24.3% and 25.3% for a 3 day average of 25%
The growth rate of deaths has been: 41%, 31.7% and 26.1% for an average of 32.9%
Just trying to understand what your seeing that I may be missing.
For the last 3 days, the new case growth rates have been 24.4%, 24.3% and 25.3% for a 3 day average of 25%
The growth rate of deaths has been: 41%, 31.7% and 26.1% for an average of 32.9%
Just trying to understand what your seeing that I may be missing.
Posted on 3/27/20 at 1:53 am to Chromdome35
I am looking at your bar graphs in the OP that you updated earlier today.
The last 3 days deaths increased by 20 for 2 days and we had 21 death increase today. An increase of 20 deaths over 250 to 270 would be an increase of less than 10% The higher that your number goes and your divisor stays at about the same, that means your increase percentage is dropping.
20 = 10% of 200. 8% of 250 =20
If this same trend holds for today, there will be around 294 deaths. If there are less than that, the doctors are winning.
I was off by 5% at first. the daily increase in deaths is actually slowed down slightly, while new cases have remained at a steady increase of 26-28%.
I just used the calculator finally, like I should have done to begin with. .08x248=19.84, .09x248=22.32, so your increase in death percentage for today was less than 9%.
getting downvoted for good news
This post was edited on 3/27/20 at 7:34 am

Posted on 3/27/20 at 7:33 am to BamaAtl
quote:
Those graphs look very, very bad for the coming week.
Given what I've seen of the data, we are getting towards the end of the exponential growth stage.
We should see a turn to more linear growth at the beginning of April, and then a decelerating growth soon after.
We need to know how many people have had this and recovered and never went to the doctor. I think Dr Birx was talking about getting that antibodies information soon.

Posted on 3/27/20 at 7:53 am to TeLeFaWx
quote:
Given what I've seen of the data, we are getting towards the end of the exponential growth stage.
The lag in reporting is definitely getting shorter, but still impacts our identification of inflection points. Having said that, I agree. If CA is through their curve (and relatively unscathed) and New York is peaking - that's about 1/6 of the population and probably closer to 1/3 of the high density population.
Florida and Texas will likely have a little easier run because more space and outside of Miami, Houston and Dallas, they don't have anything like NY/NJ population densities. Hell, that's close to 1/3 of the population and, outside of places like Atlanta, New Orleans and spots in the Midwest, that is the bulk of our dense urban areas.
I don't think Easter is all that optimistic to start easing guidelines for large swaths of the middle of the country. New York will likely be doing better by Easter as well.
Posted on 3/27/20 at 7:55 am to TeLeFaWx
quote:
Given what I've seen of the data, we are getting towards the end of the exponential growth stage.
Given what we've seen on the ground and in our data, we're nowhere near the end of exponential growth.
quote:
We should see a turn to more linear growth at the beginning of April, and then a decelerating growth soon after.
Possibly in some areas, but there are parts of the country (looking at you, flyover states) that haven't even begun proper social distancing measures and have inadequate testing. This virus doesn't care who you voted for or which church you go to, it's going to hit everywhere in waves.
quote:
We need to know how many people have had this and recovered and never went to the doctor. I think Dr Birx was talking about getting that antibodies information soon.
Hopefully we'll have antibody tests by the next few weeks. That will be a game-changer, even if it shows something wildly different than expected.

 Page 80 of 331

Popular
Back to top