





 0
0






- My Forums
- Tiger Rant
- LSU Recruiting
- SEC Rant
- Saints Talk
- Pelicans Talk
- More Sports Board
- Fantasy Sports
- Golf Board
- Soccer Board
- O-T Lounge
- Tech Board
- Home/Garden Board
- Outdoor Board
- Health/Fitness Board
- Movie/TV Board
- Book Board
- Music Board
- Political Talk
- Money Talk
- Fark Board
- Gaming Board
- Travel Board
- Food/Drink Board
- Ticket Exchange
- TD Help Board
Customize My Forums- View All Forums
- Show Left Links
- Topic Sort Options
- Trending Topics
- Recent Topics
- Active Topics
Started By
Message
Posted on 3/29/20 at 6:56 pm to the808bass
(no message)
This post was edited on 3/29/20 at 6:58 pm
Posted on 3/29/20 at 6:58 pm to tiger91
As long as the trend line is down, I would imagine a little rollover doesn't really matter.
Posted on 3/29/20 at 7:03 pm to Chromdome35
The growth rate of deaths by day.
Early in the outbreak, there was a day when we went from 0 deaths to 5 deaths, a 500% increase. That skews the numbers pretty bad so I have omitted it from this.

Early in the outbreak, there was a day when we went from 0 deaths to 5 deaths, a 500% increase. That skews the numbers pretty bad so I have omitted it from this.
This post was edited on 3/29/20 at 7:07 pm
Posted on 3/29/20 at 7:07 pm to Chromdome35
quote:Wouldn’t that be an infinity increase because you can’t divide by 0?
when we went from 0 deaths to 5 deaths, a 500% increase
Posted on 3/29/20 at 7:28 pm to LSURussian
yes...another reason to omit
Posted on 3/29/20 at 8:01 pm to Chromdome35
I shared in another thread, but I’ll post here. My friend is out of the ICU and in a regular bed as of this morning. Much improved.
Posted on 3/29/20 at 8:01 pm to Chromdome35
Graphs on first page look odd. Approaching 1.5 million. Is there a scaling problem or did I pick the wrong day to start dropping acid again?
Posted on 3/29/20 at 8:17 pm to the808bass
Great to hear! 
Posted on 3/29/20 at 8:18 pm to IslandBuckeye
I fat fingered a number, its fixed now.
Today's numbers look abnormally low to me, tomorrow maybe big.
Today's numbers look abnormally low to me, tomorrow maybe big.
This post was edited on 3/29/20 at 8:20 pm
Posted on 3/29/20 at 8:20 pm to Chromdome35
Thank you for doing this
I check multiple times a day
I check multiple times a day
This post was edited on 3/29/20 at 8:20 pm
Posted on 3/29/20 at 8:43 pm to the808bass
That is great news. Where did you read that? Or just report on TV.
Posted on 3/29/20 at 8:45 pm to Winston Cup
In a week more than half of the deaths from this virus in our country will be from NYC. Keep that in mind this week as the numbers get posted. Tomorrow's numbers are going to be ugly in the death numbers from NYC today.
Posted on 3/29/20 at 9:11 pm to the808bass
You also said a friends father(?) wasn't doing well
Is he doing better?
Is he doing better?
Posted on 3/29/20 at 9:38 pm to Chromdome35
It sure would be a relief if today’s new death total of 264 is accurate. Also with the new cases number being down from Saturday.

This post was edited on 3/29/20 at 10:39 pm
Posted on 3/29/20 at 9:40 pm to LosLobos111
They’re trying to slowly wean from the vent. Still getting dialysis. It will be a long haul for him. But not worse now and seems to be showing some signs of improvement.
Posted on 3/29/20 at 9:53 pm to LSURussian
Are those your babies??!! Precious either way.
Posted on 3/29/20 at 10:00 pm to Chromdome35
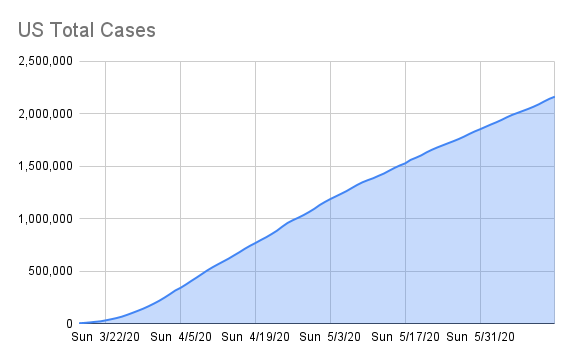
This is the link to the COVID-19 tracker that I have shared on Google Drive. Chromdome's COVID-19 Daily Tracker
The source for the data is https://www.worldometers.info/coronavirus/
The source for the testing data is from https://covidtracking.com/data/
On the tracker sheet you will see tabs for the following data:
1) US Summary
2) Country Comparables: This shows you how the US stacks up vs. select other countries dealing with COVID-19
3) Logarithmic Comparisons - Shows the US vs the other countries on the tracker.
4) Covid Vs Other Outbreaks - Compares the current COVID numbers to the last 10 years of flue and H1N1
5) US Weighted Averages - Explores 7 day vs 3 day weight average trends
6) Italy Summary
7) UK Summary
8) France Summary
9) Germany Summary
10) Sweden Summary
11) World Summary
NOTE: The daily growth rate data will not be accurate until the end of the day's postings. It will change throughout the day.
NOTE: I am not tracking individual states, I don't have a reliable consistent source for that data.
NOTE: I am not a mathematician, statistics guru, scientist, sharpest tack in the box, I'm just a guy who likes to understand for myself what is happening and to share it with others. This thread was not created to debate if you should or shouldn't take this seriously, it is simply to present the numbers and foster conversation.
I changed the formating of the numbers in the table to reflect positive movements (Green) vs negative movements (Red). This will allow you to quickly see how the numbers are moving.




The source for the data is https://www.worldometers.info/coronavirus/
The source for the testing data is from https://covidtracking.com/data/
On the tracker sheet you will see tabs for the following data:
1) US Summary
2) Country Comparables: This shows you how the US stacks up vs. select other countries dealing with COVID-19
3) Logarithmic Comparisons - Shows the US vs the other countries on the tracker.
4) Covid Vs Other Outbreaks - Compares the current COVID numbers to the last 10 years of flue and H1N1
5) US Weighted Averages - Explores 7 day vs 3 day weight average trends
6) Italy Summary
7) UK Summary
8) France Summary
9) Germany Summary
10) Sweden Summary
11) World Summary
NOTE: The daily growth rate data will not be accurate until the end of the day's postings. It will change throughout the day.
NOTE: I am not tracking individual states, I don't have a reliable consistent source for that data.
NOTE: I am not a mathematician, statistics guru, scientist, sharpest tack in the box, I'm just a guy who likes to understand for myself what is happening and to share it with others. This thread was not created to debate if you should or shouldn't take this seriously, it is simply to present the numbers and foster conversation.
I changed the formating of the numbers in the table to reflect positive movements (Green) vs negative movements (Red). This will allow you to quickly see how the numbers are moving.
Posted on 3/29/20 at 10:03 pm to Chromdome35
I'm not really sure how to take today's numbers. Part of me wants to jump with joy that there has been such a significant downturn in the growth of both cases and deaths.
Both metrics have been on a downward trend for the previous 4 days; however, today's decline was far steeper than the numbers leading into today would have suggested.
I will be a little less skeptical if tomorrow's numbers continue to show a decline.
Both metrics have been on a downward trend for the previous 4 days; however, today's decline was far steeper than the numbers leading into today would have suggested.
I will be a little less skeptical if tomorrow's numbers continue to show a decline.
Posted on 3/29/20 at 10:06 pm to Chromdome35
I really want to believe. This country needs hope.

 Page 96 of 331



Popular

Back to top
 Follow TigerDroppings for LSU Football News