- My Forums
- Tiger Rant
- LSU Recruiting
- SEC Rant
- Saints Talk
- Pelicans Talk
- More Sports Board
- Fantasy Sports
- Golf Board
- Soccer Board
- O-T Lounge
- Tech Board
- Home/Garden Board
- Outdoor Board
- Health/Fitness Board
- Movie/TV Board
- Book Board
- Music Board
- Political Talk
- Money Talk
- Fark Board
- Gaming Board
- Travel Board
- Food/Drink Board
- Ticket Exchange
- TD Help Board
Customize My Forums- View All Forums
- Show Left Links
- Topic Sort Options
- Trending Topics
- Recent Topics
- Active Topics
Started By
Message
re: Daily COVID Updated as of 11/2/20 8:00 PM
Posted on 9/23/20 at 9:46 pm to Mrtommorrow1987
Posted on 9/23/20 at 9:46 pm to Mrtommorrow1987
Not surprising, and good news. But there's no doubt the trend lines have flattened out, and we've even had an increase of 1300 hospitalizations since Sunday.
 0
0

Posted on 9/23/20 at 10:54 pm to Chromdome35
This is the link to the COVID-19 tracker that I have created and shared on Google Drive.
If you want to view the shared sheet, follow this link COVID-19 Tracker
If you want to download a copy of this sheet and manipulate it follow this link Downloadable COVID-19 Tracker
The source for the data is from https://covidtracking.com/data/


7 Day Average Growth of New Cases by State

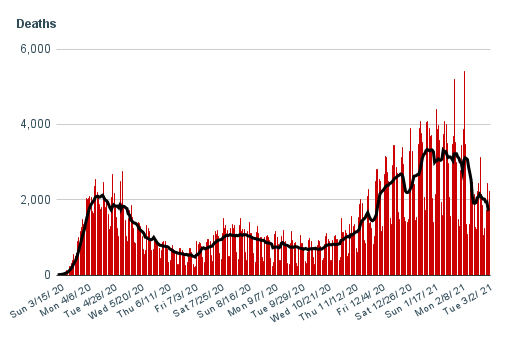
7 Day Average Growth of Deaths by State

7-day average Positivity Rate

If you want to view the shared sheet, follow this link COVID-19 Tracker
If you want to download a copy of this sheet and manipulate it follow this link Downloadable COVID-19 Tracker
The source for the data is from https://covidtracking.com/data/
7 Day Average Growth of New Cases by State
7 Day Average Growth of Deaths by State
7-day average Positivity Rate
This post was edited on 9/24/20 at 4:14 am
Posted on 9/24/20 at 3:26 am to Chromdome35
Your WOW data for yesterday doesn’t match the top data. Any reason?
Posted on 9/24/20 at 3:39 am to C
good catch, not sure why. Will figure it out and fix it tomorrow.
Update: Fixed
Update: Fixed
This post was edited on 9/24/20 at 4:15 am
Posted on 9/24/20 at 6:08 pm to Chromdome35
I spent the last few days driving and exploring the Denali Highway. The Denali Highway is a partially paved, mostly dirt road that runs 138 miles through the Alaskan wilderness. It was the original route to access Denali National Park.
There really aren't adequate words in the English language to describe how beautiful it is.
While we were driving, we came across a pond with a beaver hut, on top of the beaver hut were 2 Bald Eagles (Male and Female) dinning on the beaver who was the former occupant of the hut. We watched them for about an hour. The female flew off fairly early, but the male stayed to feast. He looked huge, maybe 3-4 ft tall standing erect. A very brave crow made an aggressive move to try to scare the eagle off, the eagle just looked at him like...really dude, that's all you got? The eagle didn't even flinch.
Here are a few pictures from the drive.
Mt. McKinnley

Denali Highway


Eagles

Crow vs Eagle


Moose

There really aren't adequate words in the English language to describe how beautiful it is.
While we were driving, we came across a pond with a beaver hut, on top of the beaver hut were 2 Bald Eagles (Male and Female) dinning on the beaver who was the former occupant of the hut. We watched them for about an hour. The female flew off fairly early, but the male stayed to feast. He looked huge, maybe 3-4 ft tall standing erect. A very brave crow made an aggressive move to try to scare the eagle off, the eagle just looked at him like...really dude, that's all you got? The eagle didn't even flinch.
Here are a few pictures from the drive.
Mt. McKinnley
Denali Highway
Eagles
Crow vs Eagle
Moose
Posted on 9/24/20 at 6:15 pm to Chromdome35
This is the link to the COVID-19 tracker that I have created and shared on Google Drive.
If you want to view the shared sheet, follow this link COVID-19 Tracker
If you want to download a copy of this sheet and manipulate it follow this link Downloadable COVID-19 Tracker
The source for the data is from https://covidtracking.com/data/


7 Day Average Growth of New Cases by State
7 Day Average Growth of Deaths by State
7-day average Positivity Rate
If you want to view the shared sheet, follow this link COVID-19 Tracker
If you want to download a copy of this sheet and manipulate it follow this link Downloadable COVID-19 Tracker
The source for the data is from https://covidtracking.com/data/
7 Day Average Growth of New Cases by State
7 Day Average Growth of Deaths by State
7-day average Positivity Rate

Posted on 9/24/20 at 6:36 pm to Chromdome35
Looks like a damn fine trip. Thanks for the pictures.
I need to travel more once things settle down.
And again, thanks for your hard work.
I need to travel more once things settle down.
And again, thanks for your hard work.
Posted on 9/24/20 at 7:26 pm to Chromdome35
I don't fully trust the data isn't inflated (the state has been exposed on this for fudging data), but Harris County, TX (Houston metro area) had 102 cases today. Massive dropoff, basically down to March/April levels.
This post was edited on 9/24/20 at 7:27 pm
Posted on 9/24/20 at 8:05 pm to Lou Pai
Yeah but it is still code “red”
Posted on 9/25/20 at 8:18 am to DMAN1968
I am dying to get back on the road when this is done. The denizens of Seattle are crazy AF, but I still enjoy my work out there. Miss it.
Posted on 9/25/20 at 6:47 pm to Chromdome35
This is the link to the COVID-19 tracker that I have created and shared on Google Drive.
If you want to view the shared sheet, follow this link COVID-19 Tracker
If you want to download a copy of this sheet and manipulate it follow this link Downloadable COVID-19 Tracker
The source for the data is from https://covidtracking.com/data/


7 Day Average Growth of New Cases by State
7 Day Average Growth of Deaths by State
7-day average Positivity Rate
If you want to view the shared sheet, follow this link COVID-19 Tracker
If you want to download a copy of this sheet and manipulate it follow this link Downloadable COVID-19 Tracker
The source for the data is from https://covidtracking.com/data/
7 Day Average Growth of New Cases by State
7 Day Average Growth of Deaths by State
7-day average Positivity Rate
Posted on 9/25/20 at 8:04 pm to Chromdome35
Where are all these magical tests coming from. 900k a day?
Posted on 9/25/20 at 8:29 pm to TigerMan327
quote:
Where are all these magical tests coming from. 900k a day?
Schools. We had 3 tests recently. All negative.

Posted on 9/25/20 at 9:02 pm to TigerMan327
quote:
Where are all these magical tests coming from. 900k a day?
Nursing homes.
Almost every nursing home in Missouri is testing employees twice a week. You could have 60 employees in one nursing home. There’s around 150 nursing homes in the St. Louis area. So just the St. Louis area nursing homes might generate 18,000 tests per week. And every tech and hospice nurse and aide is getting tested twice a week as well.
Posted on 9/25/20 at 10:48 pm to the808bass
And a whole lotta dumping this week. Check out Kentucky for instance.
Posted on 9/25/20 at 11:43 pm to AUMIS01
Over half the deaths reported this week are from Death Cert Matching, so from 4-20 weeks ago.
Posted on 9/26/20 at 6:28 am to Chromdome35
quote:
Florida governor signs order clearing restaurants and bars to fully open
quote:
"There will not be limitations, from the state of Florida," he said.
quote:
If a local government Covid-19 emergency order limiting restaurant to less than 100% of its indoor capacity but above 50%, the government must explain why the limitation is necessary for public health and quantify the economic impact of the limits.
About damn time someone did it.
Posted on 9/26/20 at 1:06 pm to the808bass
quote:
Almost every nursing home in Missouri is testing employees twice a week. You could have 60 employees in one nursing home. There’s around 150 nursing homes in the St. Louis area. So just the St. Louis area nursing homes might generate 18,000 tests per week. And every tech and hospice nurse and aide is getting tested twice a week as well
If a nursing home is in a parish or county that has a 10% or higher positivity rate they are supposed to be testing twice a week.
Posted on 9/26/20 at 6:29 pm to Chromdome35
This is the link to the COVID-19 tracker that I have created and shared on Google Drive.
If you want to view the shared sheet, follow this link COVID-19 Tracker
If you want to download a copy of this sheet and manipulate it follow this link Downloadable COVID-19 Tracker
The source for the data is from https://covidtracking.com/data/


7 Day Average Growth of New Cases by State
7 Day Average Growth of Deaths by State
7-day average Positivity Rate
If you want to view the shared sheet, follow this link COVID-19 Tracker
If you want to download a copy of this sheet and manipulate it follow this link Downloadable COVID-19 Tracker
The source for the data is from https://covidtracking.com/data/
7 Day Average Growth of New Cases by State
7 Day Average Growth of Deaths by State
7-day average Positivity Rate
Posted on 9/26/20 at 6:57 pm to AUMIS01
quote:
Data frickery continues. This damn thing is ebbing but the states continue to make a mess of this via their terrible reporting. Georgia is still reporting cases from June and July.
Cases were getting dumped a month ago, too. When you compare a 7 day average now to a seven day average a month ago the case dumping doesn’t make much difference.

 Page 318 of 331

Popular
Back to top