




 3
3






- My Forums
- Tiger Rant
- LSU Recruiting
- SEC Rant
- Saints Talk
- Pelicans Talk
- More Sports Board
- Fantasy Sports
- Golf Board
- Soccer Board
- O-T Lounge
- Tech Board
- Home/Garden Board
- Outdoor Board
- Health/Fitness Board
- Movie/TV Board
- Book Board
- Music Board
- Political Talk
- Money Talk
- Fark Board
- Gaming Board
- Travel Board
- Food/Drink Board
- Ticket Exchange
- TD Help Board
Customize My Forums- View All Forums
- Show Left Links
- Topic Sort Options
- Trending Topics
- Recent Topics
- Active Topics
Started By
Message
re: Daily COVID Updated as of 11/2/20 8:00 PM
Posted on 5/8/20 at 5:41 pm to buckeye_vol
Posted on 5/8/20 at 5:41 pm to buckeye_vol
quote:
New York City and New York State are separate data sets.
Thanks. So for NYC and NY state combined, right now they're showing about 27,200 excess all cause deaths. But almost 11,000 of those are in the non-Covid category, i.e., Covid not included on the death certificate. There will be some misdiagnosis both ways, but I wouldn't be suprised to find that a large part of the excess mortality from this event ends up due to non-Covid pathology.
This post was edited on 5/8/20 at 5:43 pm
Posted on 5/8/20 at 8:19 pm to wdhalgren
quote:A couple of things:
Thanks. So for NYC and NY state combined, right now they're showing about 27,200 excess all cause deaths. But almost 11,000 of those are in the non-Covid category, i.e., Covid not included on the death certificate.
1. As the CDC's website indicates, specifically coding the deaths results in additional delays. Looking at thee data, the week of the 25th looks be incomplete. In addition, the offical totals from both NYC and New York state both support this. So I think the COVID-19 deaths will be correctly attributed as time progresses. By my count, there are a little over 5,000 excess deaths that should not be due to COVID-19.
2. In regards to what is the cause of the excess death, New York City is one of the few jurisdictions (along with Belgium) who is categorizing "probable" COVID-19 deaths. As a result, they are two of the places where a fewer percentage of teh excess deaths are non-COVID related (e.g., fewer than 10%) whereas a bunch of places have excess deaths ranging from 40% to almost 100%.
In addition, the excess deaths are less common in countries that were praised for their testing (Germany) and more common for countries with limited testing (e.g., UK, Sweden, Spain, etc.), with such high cafe fatality rates that they're not catching a HUGE portion of any cases.
So I think that those probable deaths are valid and likely COVID, especially given the relationship between testing.
3. Excess fatalities aren't just fatalities above normal, they are fatalities above normal at statistically significant threshold, which means we would expect to just barely reach that threshold 1 out of every 40 months on average, let alone blow past it.
In addition, this also creates a margin where deaths can be in excess above normal, and especially over the course of many weeks, many of those deaths within that margin are functionally excess as error is minimized with the larger sample. So for example, over those weeks of excess in NY and NYC, there were roughly an additional 1,726 deaths above expectation in addition to the 27,516 excess deaths.
4. As I noted earlier, it looks like in both Europe and the United States, deaths are actually below normal for those under 18. I believe this is due to schools being canceled since this is where COVID-19, the seasonal flu, and any other infectious disease is earlier spread, so their infections across all of those are less than would be expected. And even though COVID-19 is far less deadly for that age group, it is clearly still deadly enough that a few hundred deaths would be possible at this point along with other infections disease deaths.
In addition, one of the most common causes of death for that group are accidents. I suspect those deaths are down as well. And I suspect that is going to show up across all age groups, especially since some car insurers were rebating consumers.
So I'm sure they'll analyze all of these data when they make their estimates of the death totals, but I suspect that we'll find some causes of deaths actually decreased. So when combined with that margin between expectation and the threshold, even if some other areas increased, most of those will be accounted for in that margin as well as being offset by deaths that were less than normal.
Furthermore, if there is an additional 80% of excess deaths that aren't COVID-19 coded, then undoubtedly some portion are COVID-19 related (pneumonia deaths are up a lot too), so on top of that "buffer" I described above (could upwards of 2,500 to 3,000 deaths week before meeting the threshold) that can account for excess non-Covid deaths, some can even be in the excess. But eventually it's just not reasonable that they are all unrelated.
So here is a reasonable possibility of death totals based on the projections going through August 4th (about 22 weeks).
1. 160,000 COVID-19 deaths.
2. 80,000 to 120,000 additional excess deaths (roughly 50 to 80 percent increase above COVID-19).
3. 55,000 deaths above expectation but less than the threshold as there is about a 2,500 weekly death margin. That is about 43,000 excess deaths reducing that 2,500 death margin of error for 22 weeks (e.g., 2,500/sqrt(22))
4. 2,000 death reduction in other common causes of death (e.g., accidents, other infectious diseases, etc.).
So altogether that would anywhere from 125,000 to 165,000 excess deaths ABOVE the COVID-19 totals if things stay how they are now (50 to 80 percent more excess deaths than COVID-19 related, lower mortality for <18, fewer accidents maybe).
I just don't think there will be any way that at least some of those aren't actually COVID-19 deaths if it's that extreme. Then again maybe when we're averaging only less than a thousand deaths per day and testing more people, we'll have fewer excess deaths unrelated to COVID-19, and the excess deaths will account for that.
Posted on 5/8/20 at 8:28 pm to wdhalgren
I also want to note that while it's understandable that there could be a few weeks to even a month lag between reporting by the states, input into the system, categorization, and analysis, but it's inexcusable that states like Connecticut and North Carolina haven't provided data in 2 months. We could at least have a better picture nationally if those 2 included their data, especially since Connecticut is one of the hardest hit states.
Also Europe has one too, although it only provides z-scores for individual countries, since much of their 173,260 excess deaths are specific to the hardest hit countries (UK, France, Spain, Belgium, Italy, Netherland, Switzerland, and Sweden). You can also see that the younger population has had fewer deaths. I would be curious to see how this differs by those countries.
European Excess Mortality
Also Europe has one too, although it only provides z-scores for individual countries, since much of their 173,260 excess deaths are specific to the hardest hit countries (UK, France, Spain, Belgium, Italy, Netherland, Switzerland, and Sweden). You can also see that the younger population has had fewer deaths. I would be curious to see how this differs by those countries.
European Excess Mortality
This post was edited on 5/8/20 at 8:37 pm
Posted on 5/8/20 at 8:30 pm to buckeye_vol
Is Friday typically a slow reporting day? Looks like the death toll today is 1,687 according to Worldometers. What does that do to the 7 day average in comparison to the week before?
I can’t thank you regulars on this thread enough for all the info you dig up.
I can’t thank you regulars on this thread enough for all the info you dig up.
Posted on 5/8/20 at 8:58 pm to Volsfan82169
quote:I hadn't noticed this until you asked, but Friday has been quite interesting, although that may be my nerdiness.
Is Friday typically a slow reporting day? Looks like the death toll today is 1,687 according to Worldometers. What does that do to the 7 day average in comparison to the week before?
I can’t thank you regulars on this thread enough for all the info you dig up
The last 3 weeks it's dropped by about 10 percent on average from Thursday and was below the 7-day moving average, but the previous 3 weeks it increased by about 10 percent on average and increased above the 7-day moving average.
Now on the one hand, those weeks were basically on either side of the peak, so we would expect the increase for the first 3 weeks and a decrease over the last 3 weeks; HOWEVER, they were more pronounced than the trends at the time.
Posted on 5/8/20 at 9:29 pm to wdhalgren
One last thing about the excess mortality data as it relates to trends I've seen in either limited testing or unusually high mortality rates (indicating limited testing for that place).
Quickly looking over the data, it appears 4 states have excess deaths that are more than 2.25 times their COVID-19 death totals (about 3 times overall) indicating for every COVID death, there are at least 1.25 other excess deaths. These 4 states are Ohio, Texas, Virgina, and Michigan.
Ohio, Texas, and Virginia are in the bottom 6 in per capita testing in the United States, all below 16,800 per million while the US overall is at 26,092 per million. And Michigan has an extremely high case fatality ratio of 9.5% compared to 5.9% in the US overall.
So my hypothesis is that the fewer infections a place is identifying, the more deaths they are going to miss, and these data support that. And there are 3 obvious ways to determine this IMO: low per capita test rate, a high CFR, and/or a high percentage of positive tests (NJ for example has a lot of excess deaths and their positive test percentage is 45.9% compared to 15.3% in the United States).
Pennsylvania's non-COVID excess deaths are really high in the CDC data, but it looks like they added those in the weeks following in a couple bunches, so that corrected.
Quickly looking over the data, it appears 4 states have excess deaths that are more than 2.25 times their COVID-19 death totals (about 3 times overall) indicating for every COVID death, there are at least 1.25 other excess deaths. These 4 states are Ohio, Texas, Virgina, and Michigan.
Ohio, Texas, and Virginia are in the bottom 6 in per capita testing in the United States, all below 16,800 per million while the US overall is at 26,092 per million. And Michigan has an extremely high case fatality ratio of 9.5% compared to 5.9% in the US overall.
So my hypothesis is that the fewer infections a place is identifying, the more deaths they are going to miss, and these data support that. And there are 3 obvious ways to determine this IMO: low per capita test rate, a high CFR, and/or a high percentage of positive tests (NJ for example has a lot of excess deaths and their positive test percentage is 45.9% compared to 15.3% in the United States).
Pennsylvania's non-COVID excess deaths are really high in the CDC data, but it looks like they added those in the weeks following in a couple bunches, so that corrected.
Posted on 5/8/20 at 9:56 pm to buckeye_vol
Nevermind. I need to make one more post because I found something crazy. West Virginia has had with 2181 excess deaths over the last 7 weeks and only 20 COVID-19. They usually average only about 423 deaths per week in March and April, so that's an 86% increase from their normal death totals which would be equivalent to about 289,000 deaths above normal in the United States (average about 8,000 deaths per day).
The thing is they fit non one of those 3 critiera that would have indicated an undercounting of cases, let alone something of this magnitude (reasonable CFR, per capita testing, and positive test percentage). But it's odd that they would have such a crazy amount of excess deaths in the middle of a pandemic, and actually start having the excess deaths when there were only a few hundred cases nationally. This is especially true since they were not a place you would expect an early outbreak (like New York).
Anyways, I have to post the graph because it's usually crazy.

The thing is they fit non one of those 3 critiera that would have indicated an undercounting of cases, let alone something of this magnitude (reasonable CFR, per capita testing, and positive test percentage). But it's odd that they would have such a crazy amount of excess deaths in the middle of a pandemic, and actually start having the excess deaths when there were only a few hundred cases nationally. This is especially true since they were not a place you would expect an early outbreak (like New York).
Anyways, I have to post the graph because it's usually crazy.
This post was edited on 5/8/20 at 10:02 pm
Posted on 5/8/20 at 10:08 pm to buckeye_vol
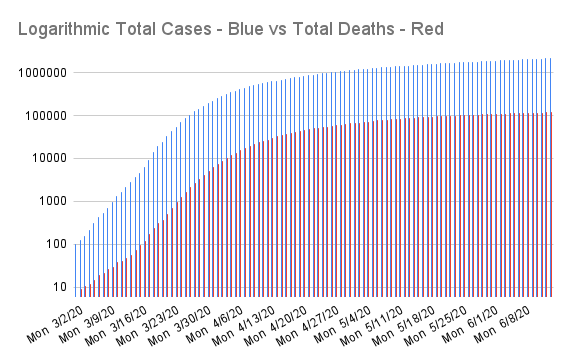
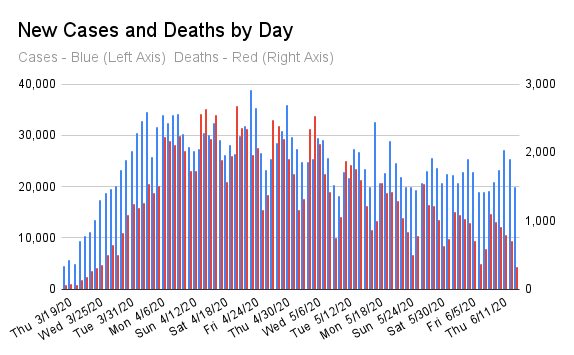
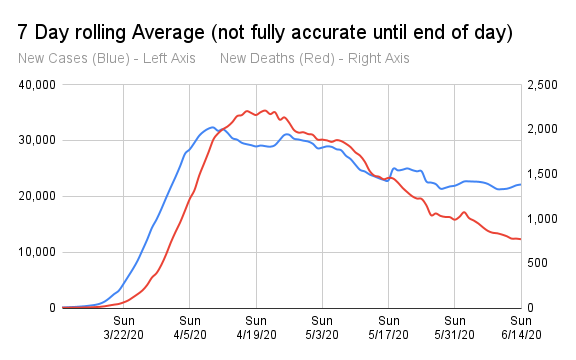
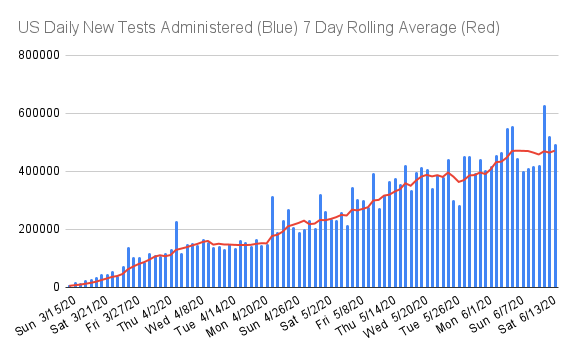
This is the link to the US state-level tracker that I have shared via Google Drive. Chromdome's State Level COVID-19 Daily Tracker
This is the link to the COVID-19 Country tracker that I have shared on Google Drive. Chromdome's COVID-19 Daily Tracker
The source for the data is https://www.worldometers.info/coronavirus/
The source for the testing data is from https://covidtracking.com/data/
NOTE: I added a little section to show Week over Week comparables at the bottom of the data grid.



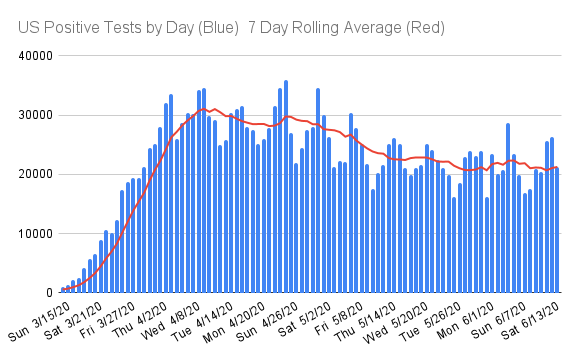
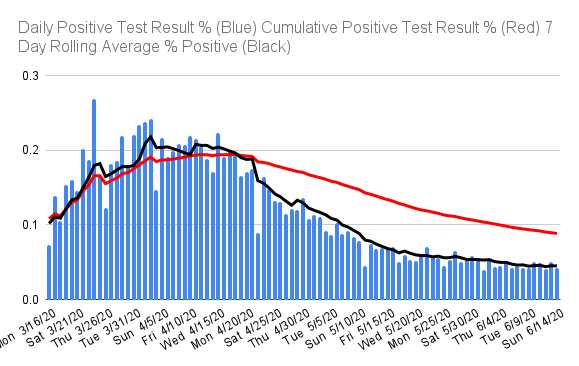

This is the link to the COVID-19 Country tracker that I have shared on Google Drive. Chromdome's COVID-19 Daily Tracker
The source for the data is https://www.worldometers.info/coronavirus/
The source for the testing data is from https://covidtracking.com/data/
NOTE: I added a little section to show Week over Week comparables at the bottom of the data grid.
This post was edited on 5/8/20 at 10:18 pm
Posted on 5/8/20 at 11:16 pm to Chromdome35
Well we’re pretty damn stuck on these 2%s for new cases
Posted on 5/8/20 at 11:28 pm to Jrv2damac
quote:As long as new cases or positive test percentage stays steady while the other goes down, I think that's a good sign overall that the infection is at the very least not growing (R around 1) and may be slowing. If both start going down, then that's a good sign that it is slowing.
Well we’re pretty damn stuck on these 2%s for new cases
The issue with all of these metrics, is that some places are decreasing, others are plateauing, and others are still are still increasing. And since the backside of the distribution appears to be more gradual than the front side, and with different states at different places on the distribution, it only makes the tail longer nationally.
Posted on 5/9/20 at 9:23 am to buckeye_vol
You use the CDC numbers and then you say they're incomplete and thus overstate non-Covid deaths. I don't agree with that approach for several reasons, but one reason in particular. Excess mortality may be a useful metric for modeling casualties due to a single variable, but there are multiple important variables in this current equation, and some of those non-viral variables are getting more important with every passing day.
When you mandate a shut down of huge parts of an economy, enforce a new regime of social isolation and regulation, use propaganda to instill fear and thus compliance, and re-align the health care system to the detriment of normal diagnosis, treatment and screening, then it's no longer accurate to assign excess mortality to an individual category, even in some cases where that category may be a contributing factor. Under that scenario, attributing excess or "probable" deaths to Covid-19 effectively discounts the consequences of the most extreme and abrupt social/economic/healthcare policy experiment since the Great Depression-WWII era. Maybe even more extreme than that in respect to the modern baselines and population.
When this started, I was very concerned about the virus, moreso than most people. Now those concerns have been overridden by the response, especially since they are changing the goals and pushing timelines out indefinitely. The non-Covid death toll from this will be high and will persistently rise for a long time, IMO, since disease screening has suffered as much or more than timely treatment, and since the negative effects of our economic disruption and "stimulus" policies will manifest more in the future. The elderly population, including in nursing homes, is always most vulnerable to disruptions, virus pathology aside, so the excess death toll there certainly includes plenty of policy induced effect already. If we're not making every effort to include the current and future contribution of all those factors in a comprehensive morbidity/mortality model, then there's no way to assess or estimate the true risk vs benefit of any decision.
When you mandate a shut down of huge parts of an economy, enforce a new regime of social isolation and regulation, use propaganda to instill fear and thus compliance, and re-align the health care system to the detriment of normal diagnosis, treatment and screening, then it's no longer accurate to assign excess mortality to an individual category, even in some cases where that category may be a contributing factor. Under that scenario, attributing excess or "probable" deaths to Covid-19 effectively discounts the consequences of the most extreme and abrupt social/economic/healthcare policy experiment since the Great Depression-WWII era. Maybe even more extreme than that in respect to the modern baselines and population.
When this started, I was very concerned about the virus, moreso than most people. Now those concerns have been overridden by the response, especially since they are changing the goals and pushing timelines out indefinitely. The non-Covid death toll from this will be high and will persistently rise for a long time, IMO, since disease screening has suffered as much or more than timely treatment, and since the negative effects of our economic disruption and "stimulus" policies will manifest more in the future. The elderly population, including in nursing homes, is always most vulnerable to disruptions, virus pathology aside, so the excess death toll there certainly includes plenty of policy induced effect already. If we're not making every effort to include the current and future contribution of all those factors in a comprehensive morbidity/mortality model, then there's no way to assess or estimate the true risk vs benefit of any decision.
This post was edited on 5/9/20 at 1:17 pm
Posted on 5/9/20 at 9:51 am to wdhalgren
quote:
and re-align the health care system to the detriment of normal diagnosis, treatment and screening, then it's no longer accurate to attribute excess mortality to an individual category.
Yeah. What this guy said.
Posted on 5/9/20 at 11:29 am to the808bass
clinical update
I've been getting my arse kicked up and down the hallways here. volume is up and so are covid cases. I'll probably end up popping positive before this is over unless I'm one of those asymptomatic cases that never gets tested.
we've used Actemra in a few cases where we caught them going into cytokine storm early with nothing short of miraculous results. it really has been impressive and stops it in it's tracks. people satting in the low 80s with high fever satting 100 a few hours later saying how much better they feel.
I've been getting my arse kicked up and down the hallways here. volume is up and so are covid cases. I'll probably end up popping positive before this is over unless I'm one of those asymptomatic cases that never gets tested.
we've used Actemra in a few cases where we caught them going into cytokine storm early with nothing short of miraculous results. it really has been impressive and stops it in it's tracks. people satting in the low 80s with high fever satting 100 a few hours later saying how much better they feel.
This post was edited on 5/9/20 at 2:11 pm
Posted on 5/9/20 at 12:19 pm to Tiguar
Italy continues with great declines. Fewest new cases for a Saturday since February. Their first documented case was on 2/20
Posted on 5/9/20 at 1:56 pm to Tiguar
quote:
we've used Actrema in a few cases where we caught them going into cytokine storm early with nothing short of miraculous results. it really has been impressive and stops it in it's tracks. people satting in the low 80s with high fever satting 100 a few hours later saying how much better they feel.
Awesome.
Posted on 5/9/20 at 3:54 pm to ValDawgsta
quote:
Italy continues with great declines. Fewest new cases for a Saturday since February. Their first documented case was on 2/20
How are your best friends in NY
Posted on 5/9/20 at 4:22 pm to Jrv2damac
quote:
How are your best friends in NY
Only know a few folks still there. They’re doing well thankfully.
Posted on 5/9/20 at 4:46 pm to ValDawgsta
Good
Wouldn’t wanna make osama proud again
Wouldn’t wanna make osama proud again
Posted on 5/9/20 at 5:14 pm to Jrv2damac
This isn’t really the thread for that stuff. Most here aren’t into the celebrating liberal deaths thing.
Posted on 5/9/20 at 5:44 pm to ValDawgsta
Nobody is doing that.
Anyway, deaths are reported in here semi daily. People are glad when it’s just a lesser number. Even that is a degree of insensitivity to the ones that do.
It’s be cool if Italy reopened. I like passing through on average once a year.
Anyway, deaths are reported in here semi daily. People are glad when it’s just a lesser number. Even that is a degree of insensitivity to the ones that do.
It’s be cool if Italy reopened. I like passing through on average once a year.
This post was edited on 5/9/20 at 7:08 pm

 Page 208 of 331



Popular

Back to top
 Follow TigerDroppings for LSU Football News