




- My Forums
- Tiger Rant
- LSU Recruiting
- SEC Rant
- Saints Talk
- Pelicans Talk
- More Sports Board
- Fantasy Sports
- Golf Board
- Soccer Board
- O-T Lounge
- Tech Board
- Home/Garden Board
- Outdoor Board
- Health/Fitness Board
- Movie/TV Board
- Book Board
- Music Board
- Political Talk
- Money Talk
- Fark Board
- Gaming Board
- Travel Board
- Food/Drink Board
- Ticket Exchange
- TD Help Board
Customize My Forums- View All Forums
- Show Left Links
- Topic Sort Options
- Trending Topics
- Recent Topics
- Active Topics
Started By
Message
re: OUST - LiDAR for Physical AI and Smart Infrastructure
Posted on 7/19/26 at 10:29 am to bayoubengals88

Posted on 7/19/26 at 10:29 am to bayoubengals88
Regarding Smart Infrastructure and software data analysis, there's only one response I have for OUST management targeting the two most important World Cup sites...ATL and NJ where the championship is today.

Just imagine the real life use case they will have going forward in American cities as they manage and monitor all traffic flows near these stadiums. Wow.
Just imagine the real life use case they will have going forward in American cities as they manage and monitor all traffic flows near these stadiums. Wow.
 1
1

Posted on 7/19/26 at 2:34 pm to bayoubengals88
I think Claude did much better than Gemini.
FIVE-YEAR SECULAR GROWTH MATRIX
Condensed Version | July 2026
Mandate: 2026 to 2031. Aggressive mid-cap and small-cap pure plays over legacy defensives. Trillion-dollar mega-caps excluded except QCOM and NBIS. Sectors ordered by immediacy of need. Micron (MU) is excluded by the mega-cap rule, not by judgment.
1. THE MODERN ENERGY GRID AND DECARBONIZATION
Macro need: Two decades of flat electricity demand ended; data center load, reshoring, and electrification now collide with a grid built for replacement rather than growth, making power the binding constraint on everything downstream in this matrix.
A. Power Generation EPC — A small set of contractors has the bonding capacity and execution record to build combined-cycle gas at scale. AGX, PRIM, MTZ, IESC
B. Transmission and Distribution Equipment — Multi-year lead times on transformers and switchgear have handed manufacturers pricing power they have not had in decades. POWL, AZZ, NVT, ATKR, HUBB
C. Grid Construction and Utility Services — Labor-constrained businesses where the scarce input is a trained lineman, not capital. PWR, DY, MYRG
D. Firm Baseload and Advanced Nuclear — The only carbon-free firm baseload option, but almost nothing here generates revenue inside the window; size as pre-revenue optionality. OKLO, SMR, BWXT, LEU, NNE, LTBR
E. Behind-the-Meter Generation and Fuel Cells — Selling time rather than electricity, letting facilities energize years before interconnection clears. BE, GNRC, FCEL, PLUG
F. Utility-Scale Solar and Deployment Hardware — Fastest-to-deploy generation, with margin sitting in trackers and electrical balance of system rather than commoditized modules; policy-dependent. FSLR, NXT, ARRY, SHLS, ENPH
G. Grid Intelligence, Metering and Resiliency — Extracting more usable capacity from existing copper is far cheaper than building new copper. ITRI, AMSC
FIVE-YEAR SECULAR GROWTH MATRIX
Condensed Version | July 2026
Mandate: 2026 to 2031. Aggressive mid-cap and small-cap pure plays over legacy defensives. Trillion-dollar mega-caps excluded except QCOM and NBIS. Sectors ordered by immediacy of need. Micron (MU) is excluded by the mega-cap rule, not by judgment.
1. THE MODERN ENERGY GRID AND DECARBONIZATION
Macro need: Two decades of flat electricity demand ended; data center load, reshoring, and electrification now collide with a grid built for replacement rather than growth, making power the binding constraint on everything downstream in this matrix.
A. Power Generation EPC — A small set of contractors has the bonding capacity and execution record to build combined-cycle gas at scale. AGX, PRIM, MTZ, IESC
B. Transmission and Distribution Equipment — Multi-year lead times on transformers and switchgear have handed manufacturers pricing power they have not had in decades. POWL, AZZ, NVT, ATKR, HUBB
C. Grid Construction and Utility Services — Labor-constrained businesses where the scarce input is a trained lineman, not capital. PWR, DY, MYRG
D. Firm Baseload and Advanced Nuclear — The only carbon-free firm baseload option, but almost nothing here generates revenue inside the window; size as pre-revenue optionality. OKLO, SMR, BWXT, LEU, NNE, LTBR
E. Behind-the-Meter Generation and Fuel Cells — Selling time rather than electricity, letting facilities energize years before interconnection clears. BE, GNRC, FCEL, PLUG
F. Utility-Scale Solar and Deployment Hardware — Fastest-to-deploy generation, with margin sitting in trackers and electrical balance of system rather than commoditized modules; policy-dependent. FSLR, NXT, ARRY, SHLS, ENPH
G. Grid Intelligence, Metering and Resiliency — Extracting more usable capacity from existing copper is far cheaper than building new copper. ITRI, AMSC
Posted on 7/19/26 at 2:34 pm to bayoubengals88
2. BATTERIES AND ENERGY STORAGE
Macro need: Renewable penetration past a threshold requires a buffer, and industrial electrification runs on duty cycles passenger-vehicle chemistry does not serve; the sector's structural weakness is that cell manufacturing is commoditized by Chinese scale, so value sits at the integration layer and in specialized niches while the middle gets crushed.
A. Grid-Scale Storage Integration — Value is supposed to migrate from the cell to the controls and service layer, a thesis repeatedly tested with disappointing margins. FLNC, EOSE, NRGV
B. Next-Generation Cell Chemistry — Targeting applications lithium-ion physically cannot serve rather than trying to out-manufacture China; mostly pre-scale with heavy dilution. AMPX, ENVX, QS, SLDP
C. Industrial and Heavy-Duty Battery Systems — ELVA competes on cycle life and thermal safety in multi-shift material handling rather than on cost per kilowatt-hour, a genuinely defensible niche that is also a genuinely small one, with high customer concentration. ELVA, FLUX
D. Domestic Materials and Supply Chain — Policy-supported processing capacity whose returns depend on subsidy and trade structures surviving a decade. MP, USAR, ALB, LAC, CRML
E. Power Conversion and Battery Management Silicon — The highest-margin layer of the storage stack and the least exposed to cell deflation, with direct read-through to data center power delivery. NVTS, POWI, MPWR, ALGM, VICR, VPG
Macro need: Renewable penetration past a threshold requires a buffer, and industrial electrification runs on duty cycles passenger-vehicle chemistry does not serve; the sector's structural weakness is that cell manufacturing is commoditized by Chinese scale, so value sits at the integration layer and in specialized niches while the middle gets crushed.
A. Grid-Scale Storage Integration — Value is supposed to migrate from the cell to the controls and service layer, a thesis repeatedly tested with disappointing margins. FLNC, EOSE, NRGV
B. Next-Generation Cell Chemistry — Targeting applications lithium-ion physically cannot serve rather than trying to out-manufacture China; mostly pre-scale with heavy dilution. AMPX, ENVX, QS, SLDP
C. Industrial and Heavy-Duty Battery Systems — ELVA competes on cycle life and thermal safety in multi-shift material handling rather than on cost per kilowatt-hour, a genuinely defensible niche that is also a genuinely small one, with high customer concentration. ELVA, FLUX
D. Domestic Materials and Supply Chain — Policy-supported processing capacity whose returns depend on subsidy and trade structures surviving a decade. MP, USAR, ALB, LAC, CRML
E. Power Conversion and Battery Management Silicon — The highest-margin layer of the storage stack and the least exposed to cell deflation, with direct read-through to data center power delivery. NVTS, POWI, MPWR, ALGM, VICR, VPG
Posted on 7/19/26 at 2:35 pm to bayoubengals88
3. VIRTUALIZED COMMUNICATION AND EDGE NETWORKS
Macro need: Traffic grows faster than carrier revenue, forcing network functions off proprietary hardware and onto software running on commodity compute, while AI inference simultaneously pushes processing toward the network edge.
A. Virtualized Broadband Access — HLIT replaces cable termination hardware with software, converting one-time cyclical hardware sales into recurring licenses, though revenue depends on a concentrated set of operators with volatile capital budgets. HLIT, CALX, ADTN
B. Network Assurance and Service Analytics — RDCM sells cloud-native assurance to tier-one carriers with recurring revenue, no debt, and high switching costs, but it is a very small company selling to very large customers into a modest total market. RDCM, VIAV, NTCT
C. RF, Millimeter Wave and Front-End Components — AMPG builds low-noise amplifiers for satcom, defense, and quantum readout chains; the technology and end markets are real, the company is small enough that this is a venture-style position rather than an equity position. AMPG, QRVO, SWKS, MRCY
D. Optical Transport and AI Data Center Interconnect — Where telecom and AI infrastructure have merged, with 800G and 1.6T demand pulled forward by model training across campuses rather than by carrier cycles. CIEN, LITE, COHR, FN, AAOI, POET
E. Non-Terrestrial Networks — Enormous addressable market, unproven economics, severe capital requirements; binary outcomes. ASTS, GILT, IRDM, GSAT
F. Edge Compute and Ruggedized Infrastructure — Inference hardware for vibration, temperature extremes, and uncontrolled power. OSS, LTRX, DIGI
Macro need: Traffic grows faster than carrier revenue, forcing network functions off proprietary hardware and onto software running on commodity compute, while AI inference simultaneously pushes processing toward the network edge.
A. Virtualized Broadband Access — HLIT replaces cable termination hardware with software, converting one-time cyclical hardware sales into recurring licenses, though revenue depends on a concentrated set of operators with volatile capital budgets. HLIT, CALX, ADTN
B. Network Assurance and Service Analytics — RDCM sells cloud-native assurance to tier-one carriers with recurring revenue, no debt, and high switching costs, but it is a very small company selling to very large customers into a modest total market. RDCM, VIAV, NTCT
C. RF, Millimeter Wave and Front-End Components — AMPG builds low-noise amplifiers for satcom, defense, and quantum readout chains; the technology and end markets are real, the company is small enough that this is a venture-style position rather than an equity position. AMPG, QRVO, SWKS, MRCY
D. Optical Transport and AI Data Center Interconnect — Where telecom and AI infrastructure have merged, with 800G and 1.6T demand pulled forward by model training across campuses rather than by carrier cycles. CIEN, LITE, COHR, FN, AAOI, POET
E. Non-Terrestrial Networks — Enormous addressable market, unproven economics, severe capital requirements; binary outcomes. ASTS, GILT, IRDM, GSAT
F. Edge Compute and Ruggedized Infrastructure — Inference hardware for vibration, temperature extremes, and uncontrolled power. OSS, LTRX, DIGI
Posted on 7/19/26 at 2:36 pm to bayoubengals88
4. ARTIFICIAL INTELLIGENCE AND ADVANCED COMPUTE
Macro need: Model scaling turned computation into a capital goods industry, and the investable insight is that the bottleneck keeps moving (accelerators, then memory, then power and thermal, now interconnect and packaging) with pricing power moving each time, so the durable position is owning what gets consumed regardless of which lab wins.
A. Neocloud and Specialized GPU Capacity — Leveraged infrastructure vehicles financed against contracted revenue; excellent when demand exceeds supply, dangerous when it does not. NBIS, CRWV, IREN, APLD, CIFR
B. Specialized Storage and the AI Data Layer — BLZE offers a low-cost, egress-friendly object tier that pairs naturally with independent compute, a correct structural insight expressed through a small company competing on price against the largest infrastructure providers on earth. BLZE, PSTG, WDC, STX
C. Cluster Interconnect and Connectivity Silicon — Signal integrity at Gen 6 speeds is hard physics, and dollar content per accelerator is rising while accelerator counts rise. ALAB, CRDO, MRVL, MTSI, SMTC
D. Memory and Storage Silicon — Structurally thin because the dominant pure play is excluded by rule; take memory exposure through sub-category E instead of pretending a small-cap substitute exists. DRAM, MRAM, SIMO
E. Advanced Packaging, Test and Metrology — Inspection intensity rises faster than wafer volume as die get stacked, so tool vendors grow faster than their customers' unit output; FORM sells probe cards as consumables tied to production rather than to capital budgets. CAMT, ONTO, FORM, KLIC, ACLS, INTT, COHU
F. Power and Thermal Infrastructure for Compute — Rack density has outrun air cooling, forcing an architectural transition that resets competitive positions and raises dollar content per rack. VRT, MOD, AAON, CLS, FLEX, SMCI
G. Data Intelligence and Applied AI Software — ZETA is separated from work management because its consumption-based identity graph business makes AI usage growth accretive rather than dilutive, though it remains a marketing technology company exposed to advertising cyclicality and privacy regulation. ZETA, INOD, SOUN, CRNC, BBAI
H. Work Management and Agentic Workflow SaaS — ASAN and MNDY own the workflow graph agents need, but they price per seat while selling a technology whose explicit promise is fewer seats, so the category is racing to shift toward consumption pricing before agents built directly on foundation models disintermediate the layer entirely; lowest conviction in the matrix. ASAN, MNDY, TEAM
Macro need: Model scaling turned computation into a capital goods industry, and the investable insight is that the bottleneck keeps moving (accelerators, then memory, then power and thermal, now interconnect and packaging) with pricing power moving each time, so the durable position is owning what gets consumed regardless of which lab wins.
A. Neocloud and Specialized GPU Capacity — Leveraged infrastructure vehicles financed against contracted revenue; excellent when demand exceeds supply, dangerous when it does not. NBIS, CRWV, IREN, APLD, CIFR
B. Specialized Storage and the AI Data Layer — BLZE offers a low-cost, egress-friendly object tier that pairs naturally with independent compute, a correct structural insight expressed through a small company competing on price against the largest infrastructure providers on earth. BLZE, PSTG, WDC, STX
C. Cluster Interconnect and Connectivity Silicon — Signal integrity at Gen 6 speeds is hard physics, and dollar content per accelerator is rising while accelerator counts rise. ALAB, CRDO, MRVL, MTSI, SMTC
D. Memory and Storage Silicon — Structurally thin because the dominant pure play is excluded by rule; take memory exposure through sub-category E instead of pretending a small-cap substitute exists. DRAM, MRAM, SIMO
E. Advanced Packaging, Test and Metrology — Inspection intensity rises faster than wafer volume as die get stacked, so tool vendors grow faster than their customers' unit output; FORM sells probe cards as consumables tied to production rather than to capital budgets. CAMT, ONTO, FORM, KLIC, ACLS, INTT, COHU
F. Power and Thermal Infrastructure for Compute — Rack density has outrun air cooling, forcing an architectural transition that resets competitive positions and raises dollar content per rack. VRT, MOD, AAON, CLS, FLEX, SMCI
G. Data Intelligence and Applied AI Software — ZETA is separated from work management because its consumption-based identity graph business makes AI usage growth accretive rather than dilutive, though it remains a marketing technology company exposed to advertising cyclicality and privacy regulation. ZETA, INOD, SOUN, CRNC, BBAI
H. Work Management and Agentic Workflow SaaS — ASAN and MNDY own the workflow graph agents need, but they price per seat while selling a technology whose explicit promise is fewer seats, so the category is racing to shift toward consumption pricing before agents built directly on foundation models disintermediate the layer entirely; lowest conviction in the matrix. ASAN, MNDY, TEAM
Posted on 7/19/26 at 2:36 pm to bayoubengals88
5. PHYSICAL AI
Macro need: Text-only intelligence captures a fraction of available economic value while labor scarcity and collapsing sensor and inference costs open the physical remainder; the honest caveat is that design wins today convert to volume in three to five years, so much of this revenue lands after the window closes, which argues for owning the silicon and sensors rather than the robots.
A. Spatial Vision and 3D Sensing — OUST measures geometry directly rather than inferring it, on a digital architecture whose cost curve follows semiconductor rather than optomechanical economics, correctly prioritizing industrial and infrastructure customers who pay today over automotive programs that pay in 2029. OUST, AEVA, INVZ, ARBE, SONY
B. Edge Inference Silicon — AMBA pairs a decade of low-power architecture with a mature toolchain that makes re-porting expensive, alongside QCOM at vastly greater scale. AMBA, QCOM, CEVA, LSCC, SYNA
C. Autonomous Platforms and Robotic Systems — Defense procurement is the reliable near-term revenue source; commercial robotics unit economics remain largely unproven. KTOS, AVAV, RCAT, ONDS, SERV
D. Motion, Actuation and Precision Manufacturing — The least discussed layer, and a supply bottleneck if robotics volumes approach projections. ROK, MEC, HLIO, TRT
E. Autonomy Software, Simulation and IP — Real-world training is too slow and too dangerous, making simulation core infrastructure; licensing captures value without manufacturing risk. ADEA, AUR, PTC
F. Positioning, Timing and Navigation — Satellite positioning fails indoors, in urban canyons, and in contested environments. TRMB, VLN
Macro need: Text-only intelligence captures a fraction of available economic value while labor scarcity and collapsing sensor and inference costs open the physical remainder; the honest caveat is that design wins today convert to volume in three to five years, so much of this revenue lands after the window closes, which argues for owning the silicon and sensors rather than the robots.
A. Spatial Vision and 3D Sensing — OUST measures geometry directly rather than inferring it, on a digital architecture whose cost curve follows semiconductor rather than optomechanical economics, correctly prioritizing industrial and infrastructure customers who pay today over automotive programs that pay in 2029. OUST, AEVA, INVZ, ARBE, SONY
B. Edge Inference Silicon — AMBA pairs a decade of low-power architecture with a mature toolchain that makes re-porting expensive, alongside QCOM at vastly greater scale. AMBA, QCOM, CEVA, LSCC, SYNA
C. Autonomous Platforms and Robotic Systems — Defense procurement is the reliable near-term revenue source; commercial robotics unit economics remain largely unproven. KTOS, AVAV, RCAT, ONDS, SERV
D. Motion, Actuation and Precision Manufacturing — The least discussed layer, and a supply bottleneck if robotics volumes approach projections. ROK, MEC, HLIO, TRT
E. Autonomy Software, Simulation and IP — Real-world training is too slow and too dangerous, making simulation core infrastructure; licensing captures value without manufacturing risk. ADEA, AUR, PTC
F. Positioning, Timing and Navigation — Satellite positioning fails indoors, in urban canyons, and in contested environments. TRMB, VLN
Posted on 7/19/26 at 2:37 pm to bayoubengals88
6. QUANTUM COMPUTING AND INFORMATION SCIENCE
Macro need: The field moved from physics problem to engineering problem, but fault-tolerant commercial computation remains years out on an unknown timeline, leaving one funded near-term revenue driver (post-quantum cryptography migration, mandated now because intercepted data is decrypted later) and one long-dated option (the computation itself).
A. Full-Stack Quantum Hardware and Software — QNT listed on Nasdaq June 4, 2026 at $60 raising $1.68 billion, combining Honeywell manufacturing discipline with Cambridge Quantum software and a trapped-ion architecture whose gate fidelity advantage matters most in the error-correction era, at the cost of slower gates and unsolved scaling. QNT, IONQ, RGTI, QBTS, INFQ
B. Photonic and Alternative Architectures — Room-temperature operation would transform deployment economics if the computational approach validates; technical claims warrant more scrutiny here than elsewhere. QUBT, POET
C. Enabling Hardware: Cryogenics, Lasers, Control and Test — The rational way to hold quantum exposure without architecture risk, since these vendors sell to every competitor and have unrelated revenue keeping them solvent; FORM appears here a second time. FORM, MKSI, LITE, ASPI
D. Post-Quantum Cryptography — The only funded, near-term revenue path in this sector, with an addressable footprint of effectively every system using public-key cryptography. LAES, ARQQ
Macro need: The field moved from physics problem to engineering problem, but fault-tolerant commercial computation remains years out on an unknown timeline, leaving one funded near-term revenue driver (post-quantum cryptography migration, mandated now because intercepted data is decrypted later) and one long-dated option (the computation itself).
A. Full-Stack Quantum Hardware and Software — QNT listed on Nasdaq June 4, 2026 at $60 raising $1.68 billion, combining Honeywell manufacturing discipline with Cambridge Quantum software and a trapped-ion architecture whose gate fidelity advantage matters most in the error-correction era, at the cost of slower gates and unsolved scaling. QNT, IONQ, RGTI, QBTS, INFQ
B. Photonic and Alternative Architectures — Room-temperature operation would transform deployment economics if the computational approach validates; technical claims warrant more scrutiny here than elsewhere. QUBT, POET
C. Enabling Hardware: Cryogenics, Lasers, Control and Test — The rational way to hold quantum exposure without architecture risk, since these vendors sell to every competitor and have unrelated revenue keeping them solvent; FORM appears here a second time. FORM, MKSI, LITE, ASPI
D. Post-Quantum Cryptography — The only funded, near-term revenue path in this sector, with an addressable footprint of effectively every system using public-key cryptography. LAES, ARQQ
Posted on 7/19/26 at 2:38 pm to bayoubengals88
TOP FIVE FOR GROWTH
Selected on current TAM, future expansion, and share-capture path, with no floor or ceiling on mandated names.
The finding first: the strongest five-year setups cluster in Sector 4 and the parts of Sector 1 feeding it. Sectors 2, 3, and 6 produced zero entries, because batteries face commoditization, virtualized telecom is a share shift inside a slow end market, and quantum has no revenue base to grow from. Physical AI produced one entry, and it is the slowest near-term grower on the list.
1. NEBIUS GROUP (NBIS) — Q1 2026 revenue of $399M up 684%, core AI cloud ARR at $1.92B, 2026 guidance of $7B to $9B ARR, a five-year $27B Meta partnership, contracted capacity raised to 4GW, and capex guided to $20B to $25B; vertical integration from custom hardware through owned facilities delivers better cost per FLOP than asset-light rivals. Risk: capex runs roughly seven times revenue, cumulative spend is modeled above $75B through 2028, the company is unprofitable per share, and counterparty concentration is severe.
2. ASTERA LABS (ALAB) — Q1 2026 revenue of $308.4M up 93% at 76.4% gross margin with Q2 guided to $355M to $365M; content per accelerator is moving beyond $1,000 while accelerator counts rise, giving share capture on two axes at once, with Scorpio switching ramping through 2026 and optics contributing from 2027. Risk: hyperscaler concentration, direct competition from Broadcom and Marvell, and the structural threat that the largest customers design this silicon internally.
3. ARGAN (AGX) — Fiscal Q1 2027 revenue of $291M up 50.2% with gross margin at 21% and EPS more than doubling to $3.24, on a $2.8B backlog roughly double the prior year, extending into industrial fabrication with a new North Carolina facility; $973.6M in cash and no debt lets it bond projects leveraged competitors cannot. Risk: project businesses have valleys, backlog is not revenue, and the stock has already run roughly 62% in six months on a premium multiple for construction services.
4. CAMTEK (CAMT) — Record 2025 revenue of $496.1M with roughly half AI-driven, Q1 2026 at $121.7M, second-half 2026 guided more than 25% above first-half, over $260M in disclosed HBM orders across 2026 and 2027, and a stated TAM above $2B by 2027; inspection intensity scales with packaging complexity rather than wafer volume, which is the correct way to own the memory bottleneck given Micron's exclusion. Risk: extreme concentration among a few HBM manufacturers, equipment cyclicality, rising opex, beta near 1.9, and China export control exposure.
5. AMBARELLA (AMBA) — FY2026 revenue of $390.7M up 37.2% with edge AI at 80% of revenue, but FY2027 guided to only 10% to 15% growth, which has to be stated plainly; the five-year case rests on a partnership exceeding $800M in potential revenue, 15+ robotic design wins, 46M cumulative SoCs shipped, and Samsung 4nm and 2nm manufacturing, selected on TAM expansion and share-capture credibility rather than current growth rate. Risk: slowest grower on the list, automotive program timelines routinely slip, GAAP profitability remains elusive, and disappointing robotics volumes make this dead money for years.
CAME CLOSE
MU — would have ranked first or second; excluded by the mega-cap rule, with CAMT as the intentional proxy. VRT — $15B+ backlog and Q4 2025 orders up 252%, but at roughly $128B market cap near 48x forward it fails the mid-cap and small-cap mandate rather than the business test; MOD is the higher-torque expression.
OUST — credible share capture and a real cost-curve advantage, but fails the current-TAM criterion; may still produce the highest percentage return in the matrix, which is a different question.
QNT — best quantum asset available, no revenue base to grow from inside the window.
CRDO — arguably interchangeable with ALAB, excluded to avoid two positions on the same interconnect thesis.
RISK REGISTER
Single variable: Sectors 1 through 4 are all levered to continued AI capital expenditure, so the sub-category structure implies diversification that does not exist and correlation goes to one in a drawdown. Valuation: the businesses are excellent and the entry prices assume the excellence continues; multiple compression on unchanged fundamentals is the likeliest source of loss. Concentration: nearly universal across the mid-cap and small-cap names here. Timing: Sectors 5 and 6 are correct theses whose revenue largely arrives after the window. Selection bias: this taxonomy had a slot pre-assigned for several existing holdings, which is fine for an allocation map and is not a test of those positions.
Figures in the Top Five were verified during preparation; verify current pricing and status before acting. Not investment advice.
Selected on current TAM, future expansion, and share-capture path, with no floor or ceiling on mandated names.
The finding first: the strongest five-year setups cluster in Sector 4 and the parts of Sector 1 feeding it. Sectors 2, 3, and 6 produced zero entries, because batteries face commoditization, virtualized telecom is a share shift inside a slow end market, and quantum has no revenue base to grow from. Physical AI produced one entry, and it is the slowest near-term grower on the list.
1. NEBIUS GROUP (NBIS) — Q1 2026 revenue of $399M up 684%, core AI cloud ARR at $1.92B, 2026 guidance of $7B to $9B ARR, a five-year $27B Meta partnership, contracted capacity raised to 4GW, and capex guided to $20B to $25B; vertical integration from custom hardware through owned facilities delivers better cost per FLOP than asset-light rivals. Risk: capex runs roughly seven times revenue, cumulative spend is modeled above $75B through 2028, the company is unprofitable per share, and counterparty concentration is severe.
2. ASTERA LABS (ALAB) — Q1 2026 revenue of $308.4M up 93% at 76.4% gross margin with Q2 guided to $355M to $365M; content per accelerator is moving beyond $1,000 while accelerator counts rise, giving share capture on two axes at once, with Scorpio switching ramping through 2026 and optics contributing from 2027. Risk: hyperscaler concentration, direct competition from Broadcom and Marvell, and the structural threat that the largest customers design this silicon internally.
3. ARGAN (AGX) — Fiscal Q1 2027 revenue of $291M up 50.2% with gross margin at 21% and EPS more than doubling to $3.24, on a $2.8B backlog roughly double the prior year, extending into industrial fabrication with a new North Carolina facility; $973.6M in cash and no debt lets it bond projects leveraged competitors cannot. Risk: project businesses have valleys, backlog is not revenue, and the stock has already run roughly 62% in six months on a premium multiple for construction services.
4. CAMTEK (CAMT) — Record 2025 revenue of $496.1M with roughly half AI-driven, Q1 2026 at $121.7M, second-half 2026 guided more than 25% above first-half, over $260M in disclosed HBM orders across 2026 and 2027, and a stated TAM above $2B by 2027; inspection intensity scales with packaging complexity rather than wafer volume, which is the correct way to own the memory bottleneck given Micron's exclusion. Risk: extreme concentration among a few HBM manufacturers, equipment cyclicality, rising opex, beta near 1.9, and China export control exposure.
5. AMBARELLA (AMBA) — FY2026 revenue of $390.7M up 37.2% with edge AI at 80% of revenue, but FY2027 guided to only 10% to 15% growth, which has to be stated plainly; the five-year case rests on a partnership exceeding $800M in potential revenue, 15+ robotic design wins, 46M cumulative SoCs shipped, and Samsung 4nm and 2nm manufacturing, selected on TAM expansion and share-capture credibility rather than current growth rate. Risk: slowest grower on the list, automotive program timelines routinely slip, GAAP profitability remains elusive, and disappointing robotics volumes make this dead money for years.
CAME CLOSE
MU — would have ranked first or second; excluded by the mega-cap rule, with CAMT as the intentional proxy. VRT — $15B+ backlog and Q4 2025 orders up 252%, but at roughly $128B market cap near 48x forward it fails the mid-cap and small-cap mandate rather than the business test; MOD is the higher-torque expression.
OUST — credible share capture and a real cost-curve advantage, but fails the current-TAM criterion; may still produce the highest percentage return in the matrix, which is a different question.
QNT — best quantum asset available, no revenue base to grow from inside the window.
CRDO — arguably interchangeable with ALAB, excluded to avoid two positions on the same interconnect thesis.
RISK REGISTER
Single variable: Sectors 1 through 4 are all levered to continued AI capital expenditure, so the sub-category structure implies diversification that does not exist and correlation goes to one in a drawdown. Valuation: the businesses are excellent and the entry prices assume the excellence continues; multiple compression on unchanged fundamentals is the likeliest source of loss. Concentration: nearly universal across the mid-cap and small-cap names here. Timing: Sectors 5 and 6 are correct theses whose revenue largely arrives after the window. Selection bias: this taxonomy had a slot pre-assigned for several existing holdings, which is fine for an allocation map and is not a test of those positions.
Figures in the Top Five were verified during preparation; verify current pricing and status before acting. Not investment advice.
This post was edited on 7/19/26 at 2:39 pm
Posted on 7/19/26 at 9:02 pm to bayoubengals88
The biggest takeaway for this thread is from the TLDR in the other thread:
5. Physical AI.
Real, but mostly a post-2031 revenue story. Design wins today ship in volume three to five years out. Own the sensors and silicon (OUST, AMBA, QCOM) rather than the robots
5. Physical AI.
Real, but mostly a post-2031 revenue story. Design wins today ship in volume three to five years out. Own the sensors and silicon (OUST, AMBA, QCOM) rather than the robots


Posted on 7/20/26 at 8:37 am to bayoubengals88
Obviously OUST is a thematic play in robotics, and it is high beta that has bounced around a ton with the news around neo-clouds/hyper-scalers/memory companies, but to me its story is a little bit more separated from those than its broad market action has been implying.
I have hope that moving forward through the rest of 2026 and into 2027/2028, it’s moment in the market will be a bit more disconnected from pure AI companies movement.
I have hope that moving forward through the rest of 2026 and into 2027/2028, it’s moment in the market will be a bit more disconnected from pure AI companies movement.

Posted on 7/20/26 at 10:07 am to bayoubengals88
Are you still buying at these levels?
Posted on 7/20/26 at 11:47 am to bayoubengals88
Low 35s. Easy add spot. Not thinking twice about it.
Posted on 7/20/26 at 11:56 am to PlootyPlucker90
quote:I'm adding LEAPS at these levels, which is MORE than buying
Are you still buying at these levels?

I've got an equity report that'll knock your socks off regarding the value of OUST at $35/share.
This post was edited on 7/20/26 at 11:57 am

Posted on 7/20/26 at 12:40 pm to PlootyPlucker90
Buy Buy Buy!
Posted on 7/20/26 at 12:46 pm to StonewallJack
Just bought more shares at $35.13.
This post was edited on 7/20/26 at 1:18 pm
Posted on 7/20/26 at 6:34 pm to bayoubengals88
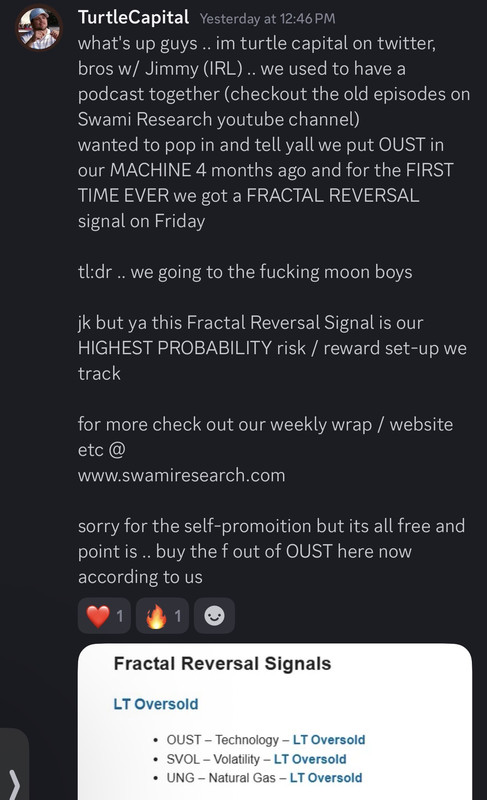
TurtleCapital is one of the “in-crowd” of OUST investors I follow - along with ppdd on X and jimmyrunsmoney (my source for the IRL Ouster San Fran meeting from a month or so ago)
Jury is out to see if he is correct about the reversal but it is some much-needed hope after being beaten down badly these last couple weeks. Conviction isn’t shaken, accumulating at sub $36 as of now.
————————————-
What is a fractal reversal you may ask?
A bullish fractal signifies a potential upward trend reversal.
Structure: It forms when a candle’s low is the lowest among a 5-candle span, with the two preceding and two succeeding candles displaying higher lows.
Signal: Traders often use this pattern to identify support levels or as a signal to enter a long position (buying) or exit a short position.
RSI is also in neutral territory (currently shows as 41.22)
Daily RSI in oversold territory
————————
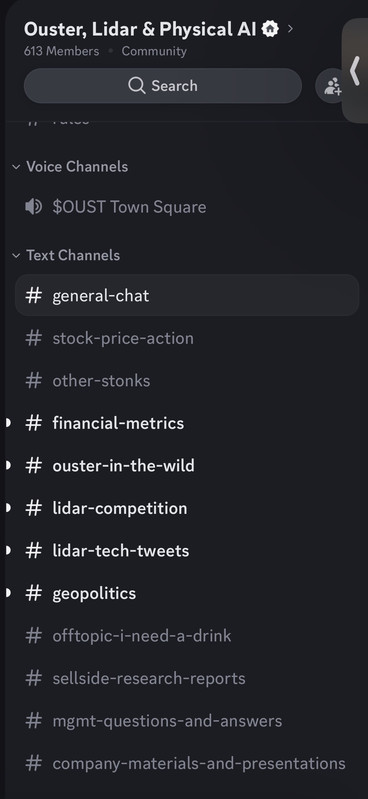
If anyone wants to join the discussion of informed Ouster investors, there is a group of 600 of us here: Ouster Discord Link, Started By PPDD
Here is a view on what they keep updated regarding OUST news:
This post was edited on 7/20/26 at 6:57 pm
Posted on 7/20/26 at 6:54 pm to iPad
I would welcome that as I’m all options now and would prefer to not hold all of them for too long.
Especially with earnings.
I’ll be selling into any earnings pump and saving cash, diversifying into boring, and buying OUST shares
Especially with earnings.
I’ll be selling into any earnings pump and saving cash, diversifying into boring, and buying OUST shares
Posted on 7/20/26 at 7:50 pm to bayoubengals88
I’m holding 875 shares right at a $40 average.
I’ll hold until 2030 if that’s what it takes
I’ll hold until 2030 if that’s what it takes
Posted on 7/20/26 at 7:58 pm to Bayou_Tiger_225
2030 revenue of 847mm would be on target.
If a 10x multiplier holds then 8.47 billion mc.
8,470,000,000/80,000,000=105.875
$106/share
8,470,000,000/70,000,000=121
At 70mm shares outstanding it’s $121 a share. Dilution matters.
These share prices are pretty conservative without any real hype.
Thoughts?
If a 10x multiplier holds then 8.47 billion mc.
8,470,000,000/80,000,000=105.875
$106/share
8,470,000,000/70,000,000=121
At 70mm shares outstanding it’s $121 a share. Dilution matters.
These share prices are pretty conservative without any real hype.
Thoughts?
Posted on 7/20/26 at 8:09 pm to bayoubengals88
From a pure numbers perspective it looks pretty solid and I agree, conservative.
What I like about OUST is there are quite a few different potential catalyst.
Widespread blue city adoption.
Congressional acts requiring US made
Expansion of current potential partnerships
What I like about OUST is there are quite a few different potential catalyst.
Widespread blue city adoption.
Congressional acts requiring US made
Expansion of current potential partnerships

 Page 54 of 57

Popular
Back to top
 Follow TigerDroppings for LSU Football News