- My Forums
- Tiger Rant
- LSU Recruiting
- SEC Rant
- Saints Talk
- Pelicans Talk
- More Sports Board
- Fantasy Sports
- Golf Board
- Soccer Board
- O-T Lounge
- Tech Board
- Home/Garden Board
- Outdoor Board
- Health/Fitness Board
- Movie/TV Board
- Book Board
- Music Board
- Political Talk
- Money Talk
- Fark Board
- Gaming Board
- Travel Board
- Food/Drink Board
- Ticket Exchange
- TD Help Board
Customize My Forums- View All Forums
- Show Left Links
- Topic Sort Options
- Trending Topics
- Recent Topics
- Active Topics
Started By
Message
re: Daily COVID Updated as of 11/2/20 8:00 PM
Posted on 8/3/20 at 9:42 pm to FlySaint
Posted on 8/3/20 at 9:42 pm to FlySaint
The COVID tracking project just did a comparison of both methods and determined the curves are basically the same and presenting by day reported is not materially different than using day of death.
https://covidtracking.com/blog/is-there-a-right-way-to-chart-covid-19-deaths-over-time
https://covidtracking.com/blog/is-there-a-right-way-to-chart-covid-19-deaths-over-time
quote:
Our analysis suggests that tracking deaths by date of report is an effective, fast way of following the trends in deaths over time. While, ultimately, the date-of-death method will generate more precise statistics, public health officials and the public at large need the immediate and understandable view of trends that the date-of-report method provides. Officials should strive to include a seven-day average when presenting death data using date-of-report.
This post was edited on 8/3/20 at 9:44 pm
 3
3

Posted on 8/3/20 at 9:50 pm to Chromdome35
I’m curious as to how long it takes you to put this together everyday?! I’m so not a numbers person but I’m thankful for those who are! 
Posted on 8/3/20 at 9:54 pm to tiger91
Now that I have it mostly automated, it takes me about 10 minutes from the time I start to when I hit submit on here.
I wrote a program to download the data, import it into Microsoft Access, calculate all the trending data, export it into .csv format so I can import it into Google Sheets. Once it imports into Google Sheets, everything updates automatically from there. It's basically a bunch of formulas.
I wrote a program to download the data, import it into Microsoft Access, calculate all the trending data, export it into .csv format so I can import it into Google Sheets. Once it imports into Google Sheets, everything updates automatically from there. It's basically a bunch of formulas.
Posted on 8/3/20 at 11:13 pm to Chromdome35
NYT article that actually approaches something resembling a cost/benefit analysis
My daily exasperation is mostly over how virtually every media outlet literally only reports on one metric: covid deaths. Nothing about suicide, mental health, child abuse, crowding out of other disease treatment, starvation, etc. NOTHING.
I was surprised to see this article sort of did go there:
My daily exasperation is mostly over how virtually every media outlet literally only reports on one metric: covid deaths. Nothing about suicide, mental health, child abuse, crowding out of other disease treatment, starvation, etc. NOTHING.
I was surprised to see this article sort of did go there:
quote:
‘The Biggest Monster’ Is Spreading. And It’s Not the Coronavirus. Tuberculosis kills 1.5 million people each year. Lockdowns and supply-chain disruptions threaten progress against the disease as well as H.I.V. and malaria.
Posted on 8/3/20 at 11:22 pm to Big Scrub TX
quote:
My daily exasperation is mostly over how virtually every media outlet literally only reports on one metric: covid deaths. Nothing about suicide, mental health, child abuse, crowding out of other disease treatment, starvation, etc. NOTHING.
There has actually been quite a bit written about it. Not necessarily "reported" because that would take a media not politicizing the flu, but quite a few "experts" write about it, and I tend to believe these experts because they're never found on the cover of Style magazine.
It's been known for a while that the human cost of lockdowns will be more than an order of magnitude greater than lives saved by them.
Posted on 8/3/20 at 11:25 pm to Chromdome35
quote:
The COVID tracking project just did a comparison of both methods and determined the curves are basically the same and presenting by day reported is not materially different than using day of death.
I can't speak for anywhere else, but this is very much untrue for the state of Arizona.
Posted on 8/3/20 at 11:47 pm to David_DJS
Interesting, the comparisons done by COVID Tracking specifically included Arizona. The comparison graph is down by the bottom of the article on the left.
What data are you looking at that shows something else?
What data are you looking at that shows something else?
Posted on 8/3/20 at 11:57 pm to Chromdome35
quote:
What data are you looking at that shows something else?
The state's.
And maybe I should have been more clear in my comments. The graph the state updates daily is accurate, and that's what is pasted in the report you linked. However, these graphs (cases and deaths) do not reflect the daily totals reported, and most Arizonans only see these numbers as that's what is shown/read on TV and radio here. Nobody bothers to explain that when 185 deaths are reported on July XX, those are actually deaths that were recorded over a period that goes as far back as March due to the COVID death harvesting effort by the state.
So other than more deaths and far more cases being reported than are real, the graphs the state publishes are a good representation. It's the "daily box score" that is inaccurate, and paints a very different picture than the graphs themselves.
Posted on 8/4/20 at 8:15 am to Chromdome35
I’m guessing this has been addressed but could you please let me know where to find demographic info on deaths? (i.e., age, race, co-morbidity correlations, etc.)

Posted on 8/4/20 at 8:30 am to Big Scrub TX
quote:
My daily exasperation is mostly over how virtually every media outlet literally only reports on one metric: covid deaths.
Mine, too. This tradition goes back to Vietnam coverage where the press used that metric as a hammer against the administration. Back then, they started it against LBJ, but escalated against Nixon.
For OIF/OEF, they did it to W, but then dropped that type of reporting (and certainly the emphasis on the death count) during Obama.
Posted on 8/4/20 at 8:35 am to Knight of Old
quote:The CDC data has considerable lags, but here are the provisional death data by various demographics:
I’m guessing this has been addressed but could you please let me know where to find demographic info on deaths? (i.e., age, race, co-morbidity correlations, etc.)
Provisional Death Counts for Coronavirus Disease 2019 (COVID-19)
Posted on 8/4/20 at 5:13 pm to Chromdome35
There is something wrong with the COVID Tracking Project data for today. Tests are showing as 0. Working on it.
Posted on 8/4/20 at 5:24 pm to Chromdome35
Yeah I hope the data is messed up today, currently showing 150k deaths and almost 5 million cases. :) Something broke on the test number for the day and now it's percolated through the other metrics.
Posted on 8/4/20 at 5:29 pm to AUMIS01
it looks like the data is (Todays values + Yesterday's Totals) * 2
They will fix it.
UPDATE 5:45PM: They fixed it. Update below
They will fix it.
UPDATE 5:45PM: They fixed it. Update below
This post was edited on 8/4/20 at 5:47 pm
Posted on 8/4/20 at 5:46 pm to Chromdome35
This is the link to the COVID-19 tracker that I have created and shared on Google Drive.
If you want to view the shared sheet, follow this link COVID-19 Tracker
If you want to download a copy of this sheet and manipulate it follow this link Downloadable COVID-19 Tracker
The source for the data is from https://covidtracking.com/data/


New Cases by State

New Deaths by State

7-day average growth rate of new cases

If you want to view the shared sheet, follow this link COVID-19 Tracker
If you want to download a copy of this sheet and manipulate it follow this link Downloadable COVID-19 Tracker
The source for the data is from https://covidtracking.com/data/
New Cases by State
New Deaths by State
7-day average growth rate of new cases
Posted on 8/4/20 at 5:54 pm to Chromdome35
Testing volume is really declining, fortunately, the positivity rate isn't climbing and continues to show a downward movement.
Testing at 695K today with a positivity rate of 7.4% yielded 51.5K new cases for the day.
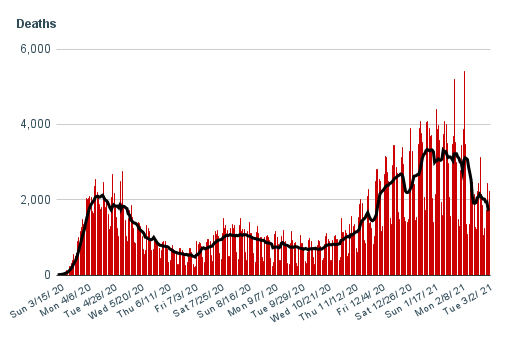
Deaths were 1,176 today a 4.9% increase over last Tuesday. To my eye, it looks like the death curve may be starting to flatten out, the 7-day average growth rate has been stuck at .7% for 13 days.
This graph shows the flattening out of the growth rate in deaths quite well.

Kansas was the only state to not report any new cases for the day.
AK, CT, GA, HI, KS, ME, MT, NE, NH, VT, and WY reported 0 deaths today.
Testing at 695K today with a positivity rate of 7.4% yielded 51.5K new cases for the day.
Deaths were 1,176 today a 4.9% increase over last Tuesday. To my eye, it looks like the death curve may be starting to flatten out, the 7-day average growth rate has been stuck at .7% for 13 days.
This graph shows the flattening out of the growth rate in deaths quite well.
Kansas was the only state to not report any new cases for the day.
AK, CT, GA, HI, KS, ME, MT, NE, NH, VT, and WY reported 0 deaths today.
Posted on 8/4/20 at 6:28 pm to Chromdome35
COVID Tracking Project is having some issues with their data collection it appears. Georgia reported 81 deaths today. Likely offset though by the overreporting in their metrics of deaths in Texas that they didn't roll up a few days ago. All evens out in the end as long as the differences are accounted for within a few days. Tomorrow could be a bit brutal on the death number if they start to catch up.
I expect Georgia death numbers to start to drop in the next week or so, if the 2-3 week lag behind cases is true. Georgia 7 day average cases, by date of onset instead of reporting, have dropped 33% from July 11-21. Date of reporting still has us higher but it has started to reflect that and turn down as well. Our deaths are still below the highs hit in April.
I expect Georgia death numbers to start to drop in the next week or so, if the 2-3 week lag behind cases is true. Georgia 7 day average cases, by date of onset instead of reporting, have dropped 33% from July 11-21. Date of reporting still has us higher but it has started to reflect that and turn down as well. Our deaths are still below the highs hit in April.
Posted on 8/4/20 at 7:00 pm to AUMIS01
I put most of my attention to the 7-day average numbers as those smooth out the reporting fluctuations every state seems to have.
For GA, testing is seeing a sharp decline, cases are following along with that; however, the decline in cases did begin before the decline in testing. That was caused by a positivity rate that is on a definite downward trend.
Cases were down 40% from last week, but testing was down 47%.
Hospitalizations in GA are showing a slow decline. They have been hovering around 3K for the last couple of weeks.

Posted on 8/4/20 at 8:05 pm to Chromdome35
Sounds like we're losing momentum for that August 9th peak called a while back.
Posted on 8/4/20 at 8:12 pm to oklahogjr
quote:
Sounds like we're losing momentum for that August 9th peak called a while back.
How so?
ETA: cases or deaths?
This post was edited on 8/4/20 at 8:13 pm

 Page 281 of 331

Popular
Back to top