- My Forums
- Tiger Rant
- LSU Recruiting
- SEC Rant
- Saints Talk
- Pelicans Talk
- More Sports Board
- Fantasy Sports
- Golf Board
- Soccer Board
- O-T Lounge
- Tech Board
- Home/Garden Board
- Outdoor Board
- Health/Fitness Board
- Movie/TV Board
- Book Board
- Music Board
- Political Talk
- Money Talk
- Fark Board
- Gaming Board
- Travel Board
- Food/Drink Board
- Ticket Exchange
- TD Help Board
Customize My Forums- View All Forums
- Show Left Links
- Topic Sort Options
- Trending Topics
- Recent Topics
- Active Topics
Started By
Message
re: Daily COVID Updated as of 11/2/20 8:00 PM
Posted on 3/25/20 at 9:38 pm to buckeye_vol

Posted on 3/25/20 at 9:38 pm to buckeye_vol
quote:
Right now there aren't enough tests nor enough resources to focus on doing a bunch of tests to people who may be recovered.
Recoveries will lag onset by as much as 20-22 days (not including the time for 2 tests and results), as well. So if you go back 20 days, recoveries may not be as ridiculously low as it would initially seem.
 0
0

Posted on 3/25/20 at 9:48 pm to Chromdome35
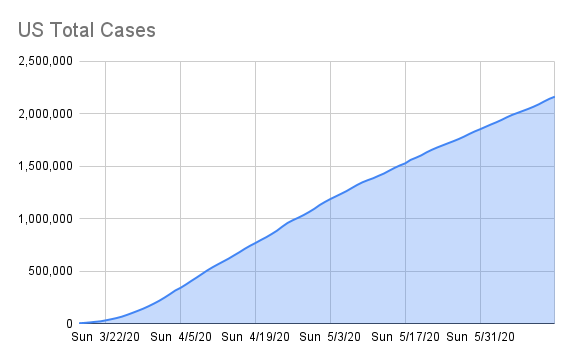
Final numbers today come in.
Posted on 3/25/20 at 9:53 pm to Chromdome35
This is the link to the COVID-19 tracker that I have shared on Google Drive. Chromdome's COVID-19 Daily Tracker
The source for the data is https://www.worldometers.info/coronavirus/
The source for the testing data is from https://covidtracking.com/data/
On the tracker sheet you will see tabs for the following data:
1) US Summary
2) Country Comparables: This shows you how the US stacks up vs. select other countries dealing with COVID-19
3) Italy Summary
4) UK Summary
5) France Summary
6) Germany Summary
New Tabs Added in the last day
7) US Weighted Averages - Explores 7 day vs 3 day weight average trends
8) Predictive Model - A simple predictive model that shows where the numbers will be in the future if growth rates don't change
If you would like a graph created that I don't have, just ask and if it's possible I will create it for you.
Due to space constraints on the PT board, I'm only posting a few graphs in the thread, if a consensus emerges of what graphs the PT wants to see in thread without having to go to the tracker, I will gladly change them up.
I am working to create a sheet that compares the US metrics to the other countries metrics. I'll let you all know when that's done and available.
NOTE: The daily growth rate data will not be accurate until the end of the day's postings. It will change throughout the day.
NOTE: I am not tracking individual states, I don't have a reliable consistent source for that data.
NOTE: I am not a mathematician, statistics guru, scientist, sharpest tack in the box, I'm just a guy who likes to understand for myself what is happening and to share it with others. This thread was not created to debate if you should or shouldn't take this seriously, it is simply to present the numbers and foster conversation.
This post was edited on 3/25/20 at 10:55 pm
Posted on 3/25/20 at 9:54 pm to Chromdome35
Well shite. I was optimistic with the slow start today. Hopefully tomorrow brings better numbers

Posted on 3/25/20 at 9:54 pm to ConwayGamecock
quote:
China's is extremely sketchy. 91% of their cases have already recovered??? And they haven't any vaccine yet?? Highly doubtful.
I'm not sure where to begin with this. Sure, you can question China's reporting just on the face of it. They've lied this whole time.
But, a ~98% recovery would be expected over time, so I'm not sure why you would question that number on its face (regardless of trusting their reporting).
A vaccine is something altogether different. Zero to do with recovery. It is an artificial herd immunity, in a manner of speaking. It prevents it. It would have no effect on "recovery" and, hopefully, a significant effect on the effective R0, overall infection rates, etc.
This virus does 1 of 5 things (6 if you count, "Miss me with that"):
1. You're exposed to it, but don't develop an infection (0 Days)
2. You're exposed to it, develop an infection, but have few, if any symptoms. (Infectious for a couple of weeks)
3. You're exposed to it, develop moderate symptoms, but recover with self-care, bed rest, etc. (Infectious for a
couple of weeks, and probably 3 weeks before you're 100%)
4. You're exposed to it, develop serious symptoms, require hospitalization and significant intervention and recover. (1 to 2 months to recover)
5. You're exposed to it, develop serious symptoms, require hospitalization and ultimately succumb to the disease (typically 14 to 20 days)
The panic and hysteria is based around the 4s and 5s. 4s overload resources that could, maybe, save more of the 5s. The reporting around the 5s panics the shite out of the Ians and Karens.
This post was edited on 3/25/20 at 10:16 pm

Posted on 3/25/20 at 9:59 pm to ConwayGamecock
quote:
It's amazing how badly New York is being ravaged right now by this.
New York City is full of multifamily buildings and a mass transit system widely used by the public. They have a massive number of residents put into a small piece of real estate. They are a very social minded society. It makes perfect sense that this is happening. NYC has more than half of all NY State COVID cases.
This will hit heavily populated urban city's harder than others just because of the close proximity of so many citizens. Especially since this is a highly contagious
Posted on 3/25/20 at 10:01 pm to Chromdome35
One positive is the new case growth RATE has fallen for 4 days straight. Still not near zero but at least it's slowly falling.
3/22 38.6
3/23 30.4
3/24 25.4
3/25 24.3
3/22 38.6
3/23 30.4
3/24 25.4
3/25 24.3
This post was edited on 3/25/20 at 10:03 pm
Posted on 3/25/20 at 10:03 pm to NorthEndZone
NEZ, agreed. You would expect that to start showing up in the numbers soon.
Posted on 3/25/20 at 10:04 pm to buckeye_vol
That’s what I’ve read as well but the dr for the state didn’t mention that unless I totally missed it which is very possible.
Posted on 3/25/20 at 10:06 pm to NorthEndZone
Is that from slowing in testing?
Posted on 3/25/20 at 10:08 pm to Chromdome35
This chart has my attention due to the growth rate of Deaths overtaking the growth rate of new Cases for the last 4 days.
I'm trying to decide if this is significant, anyone have a thought on that?

I'm trying to decide if this is significant, anyone have a thought on that?
Posted on 3/25/20 at 10:08 pm to Ace Midnight
Another incline in new daily cases. So what, there's now 6 more days of this 15 day period that Trump and Pence were talking about??
Posted on 3/25/20 at 10:10 pm to tiger91
Not sure. It could be less testing or same amount of testing with lower positive result rate. I would think by now the testing rate is at least holding steady or still increasing. Without more data it is not conclusive, but the next few days should give a us better idea if it's a good trend or testing inconsistency.
Posted on 3/25/20 at 10:12 pm to RockyMtnTigerWDE
quote:
New York City is full of multifamily buildings and a mass transit system widely used by the public. They have a massive number of residents put into a small piece of real estate. They are a very social minded society. It makes perfect sense that this is happening. NYC has more than half of all NY State COVID cases.
This will hit heavily populated urban city's harder than others just because of the close proximity of so many citizens. Especially since this is a highly contagious
Sounds like since they are all in one centralized area, if we just focused hard on them and tested everyone and even take more stringent measures, if we could clean that City down, we would take out a huge chunk of the total outbreak.
I mean, that's what the mass testing - that we have NOT done that good of a job at - is supposed to do for us, and for anyone: tell us where the centralized, hottest hot spots of the infection are located, so we can contain it.
Sounds like the numbers are showing us where the hottest hot spot in the USA is right now. Hopefully we are mobilizing in a huge way on a federal level to deal with it. NYC is the major hub of all business done in this country.....
Posted on 3/25/20 at 10:14 pm to ConwayGamecock
Muh testing
Posted on 3/25/20 at 10:16 pm to Chromdome35
quote:
This chart has my attention due to the growth rate of Deaths overtaking the growth rate of new Cases for the last 4 days.
I'm trying to decide if this is significant, anyone have a thought on that?
Wasn't the thought processes here already that once the testing picked up, there would be a period of increased new confirmed cases that would plateau, but then the new deaths cases would rise up sharply and over-take it somewhat?
Posted on 3/25/20 at 10:17 pm to Chromdome35
quote:
This chart has my attention due to the growth rate of Deaths overtaking the growth rate of new Cases for the last 4 days.
I'm trying to decide if this is significant, anyone have a thought on that?
Could I ask how you're getting a growth rate of 30+% for new deaths from March 24 (227) to March 25 (247)?
Am I missing something or has that been answered?
Posted on 3/25/20 at 10:21 pm to the808bass
So are we seeing the evidence that the virus is so widespread that the death rate is going up simply because there are enough undiagnosed cases to generate this number of deaths thereby causing what we see in the graph?

Posted on 3/25/20 at 10:25 pm to ConwayGamecock
New York is testing more people per capita than anywhere in the world
Posted on 3/25/20 at 10:27 pm to AbuTheMonkey
Abu, the growth rate comes from taking the number of new deaths today (247) and dividing it by the Total number of deaths (780) from yesterday.
247/780 = .3166 = 31.66%
Another way to think of it that might help is: Yesterday we had lost a total of 780 people. Today we lost another 247. Thats a 31.66% increase in the number of dead people.
247/780 = .3166 = 31.66%
Another way to think of it that might help is: Yesterday we had lost a total of 780 people. Today we lost another 247. Thats a 31.66% increase in the number of dead people.
This post was edited on 3/25/20 at 10:29 pm

 Page 74 of 331

Popular
Back to top