- My Forums
- Tiger Rant
- LSU Recruiting
- SEC Rant
- Saints Talk
- Pelicans Talk
- More Sports Board
- Fantasy Sports
- Golf Board
- Soccer Board
- O-T Lounge
- Tech Board
- Home/Garden Board
- Outdoor Board
- Health/Fitness Board
- Movie/TV Board
- Book Board
- Music Board
- Political Talk
- Money Talk
- Fark Board
- Gaming Board
- Travel Board
- Food/Drink Board
- Ticket Exchange
- TD Help Board
Customize My Forums- View All Forums
- Show Left Links
- Topic Sort Options
- Trending Topics
- Recent Topics
- Active Topics
Started By
Message

You know climate "scientists" cool the past and warm the present to show warming, right?
Posted on 4/25/19 at 1:27 pm

Posted on 4/25/19 at 1:27 pm
In other words the temperature data is manipulated to make it look like global warming is happening. This is how it works:
LINK
quote:
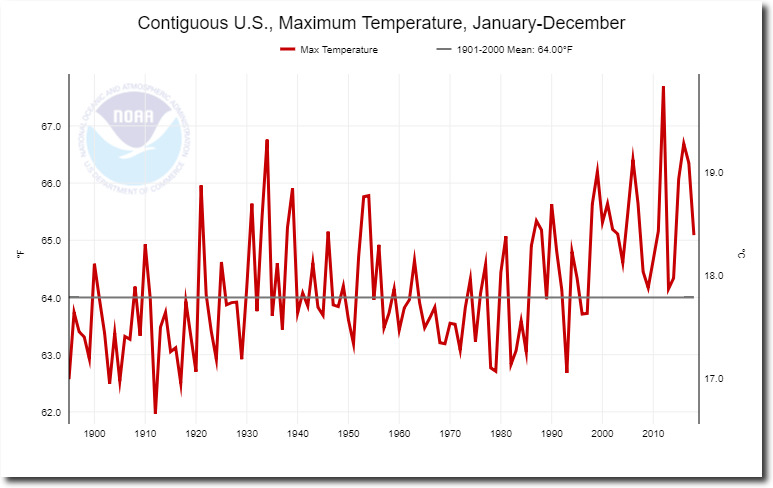
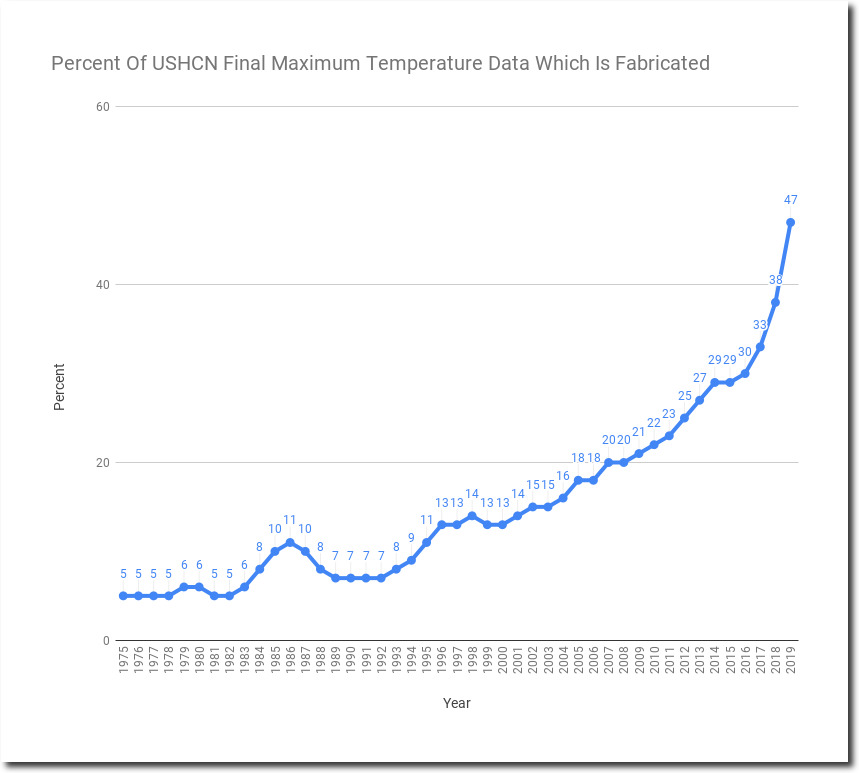
This is graph of US maximum temperatures published on their website. It shows a hockey stick of warming after 1976.
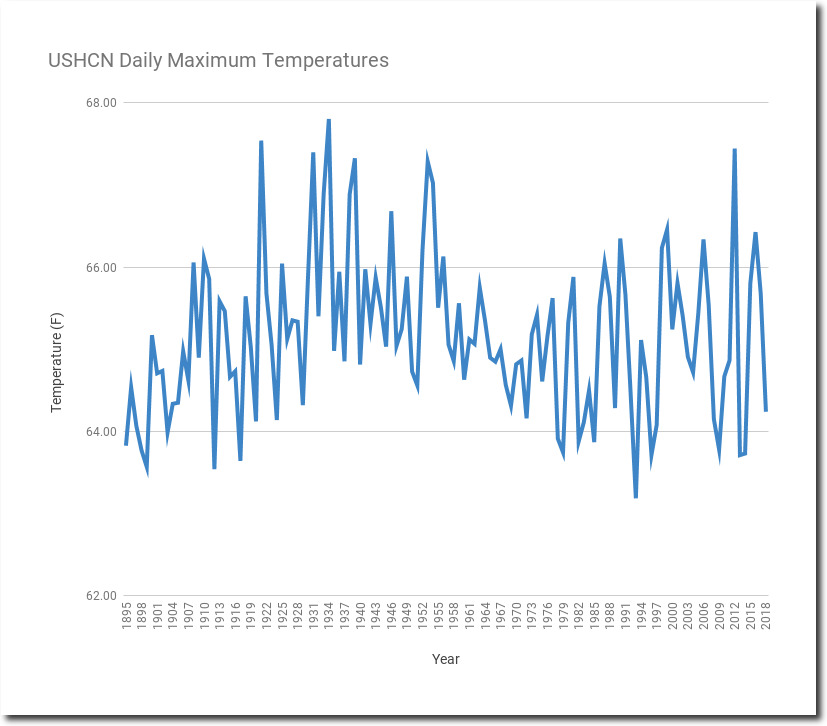
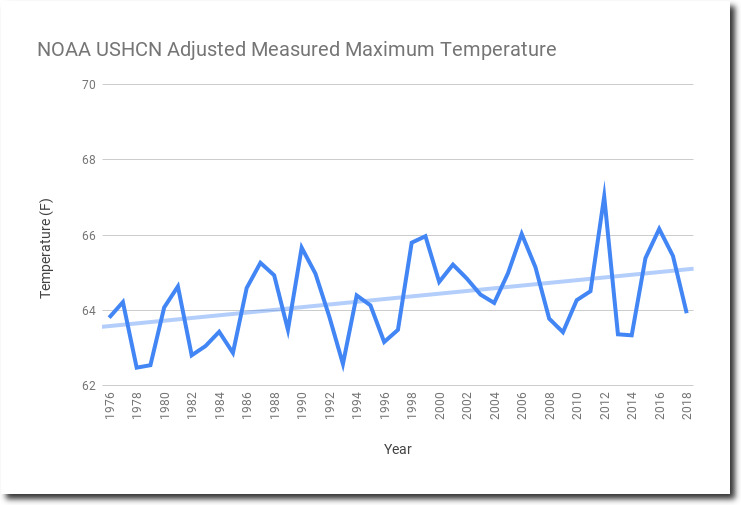
The actual measured thermometer data does not have the post-1976 hockey stick. There has been very little warming since 1976, perhaps one degree F.
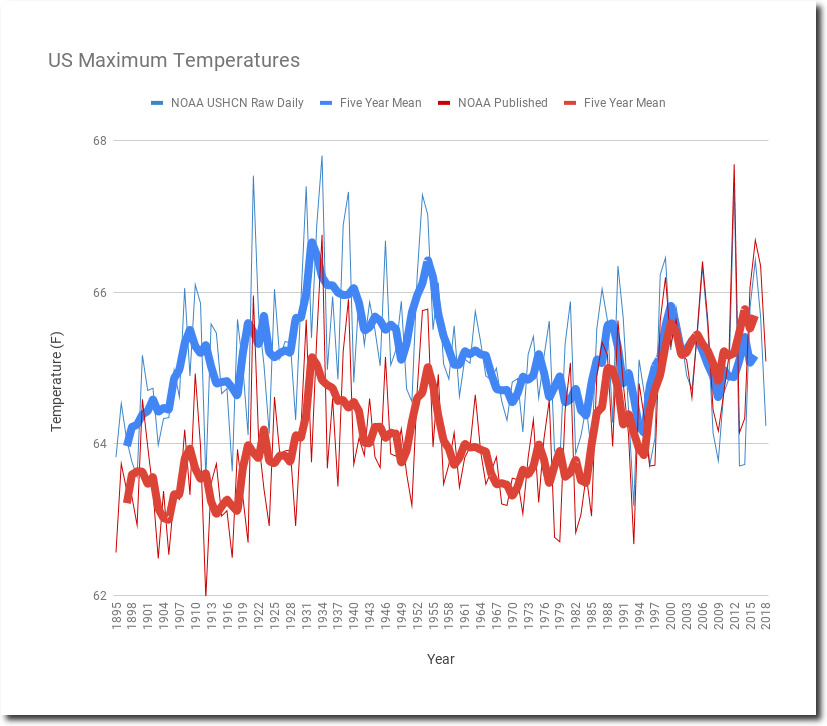
The next graph compares the measured temperatures (blue) vs. the reported (red.) The measured temperatures show long term cooling, but the reported temperatures show warming.
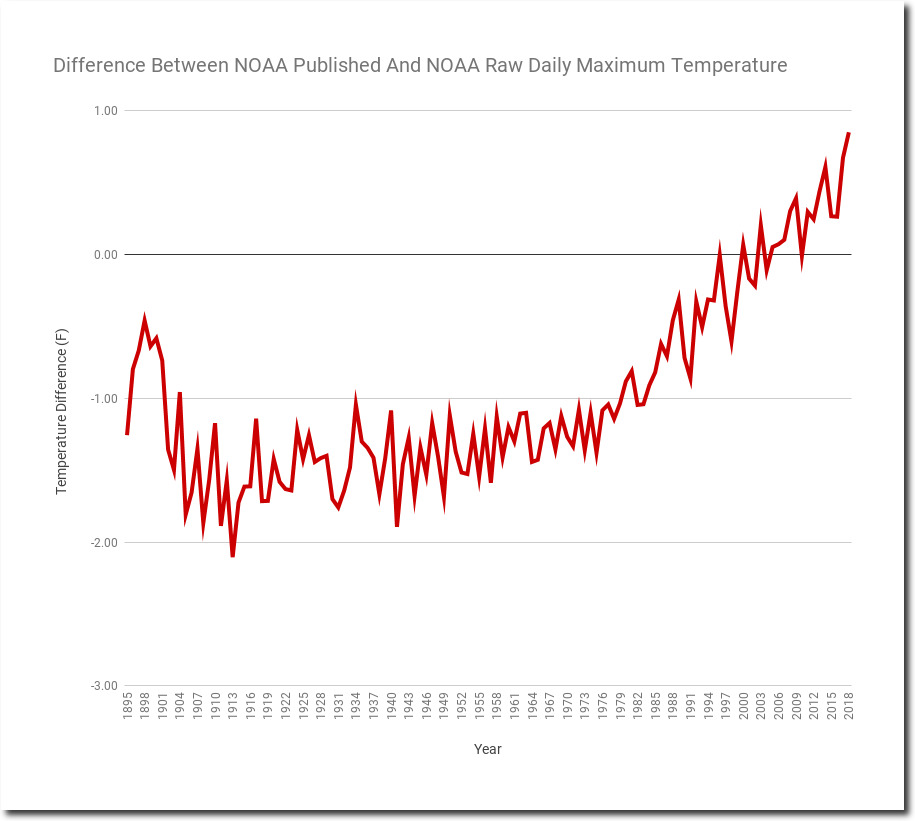
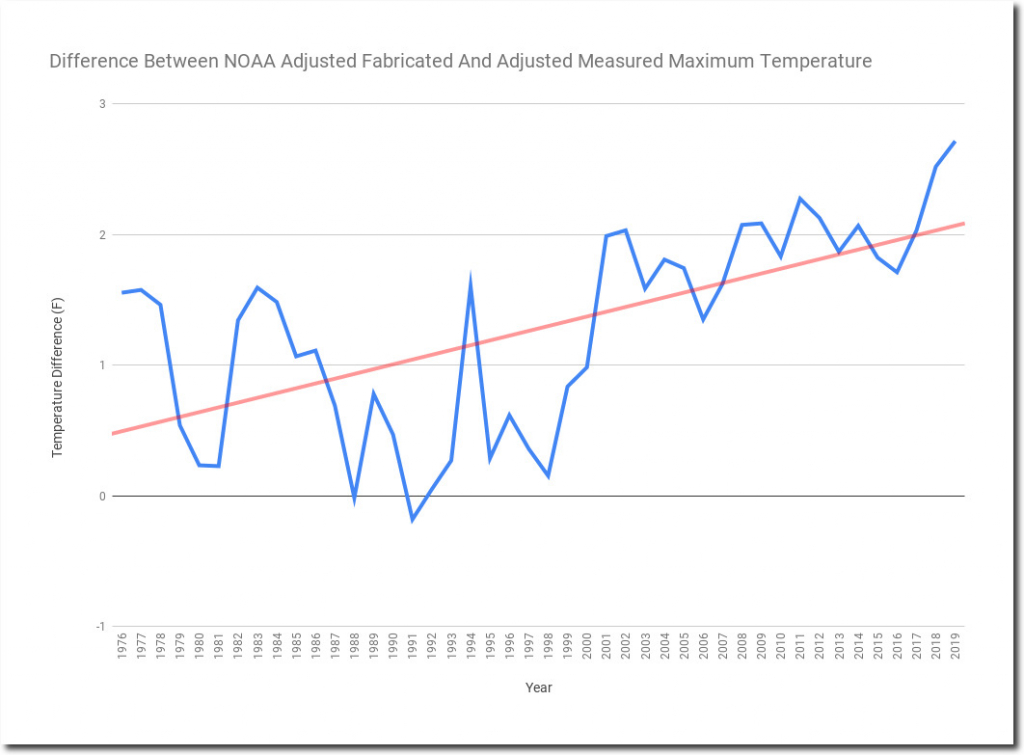
This graph shows the difference between reported and measured temperatures. The post-1976 hockey stick becomes very apparent.
So how is NOAA tampering with the data to create this hockey stick?
Alarmists claim that it is due to Time of Observation Bias or changing station composition, but that isn’t what is going on. NOAA is simply making the data up. Every month, a certain percentage of stations does not report, and are marked with an E (estimated.) The percentage of estimated (i.e. fake) data has skyrocketed from around 5% to almost 50% since 1976.
And here is the smoking gun. Comparing the fake adjusted temperatures to the measured adjusted temperatures. The measured adjusted temperatures show about one degree warming since 1976, but the fake temperatures show about three degrees warming. And almost half of the data is fake now.

The post-1976 hockey stick is created by manufacturing data, not adjusting data as alarmists claim.
Manipulating the US temperature data is very important to global warming scamsters, because the US has the vast majority of high quality long term data. Much of the rest of the world has been very busy dealing with genocide and world wars for the past century. Maintaining temperature data was a low priority for people trying to keep from being killed by their government.
LINK
 25
25


Posted on 4/25/19 at 1:30 pm to GumboPot
It’s ok. Progressives in New York have solved the global warming crisis by banning new glass & steel skyscrapers and also banning hotdogs.
Posted on 4/25/19 at 1:30 pm to GumboPot
But muh penguins

Posted on 4/25/19 at 1:33 pm to GumboPot


Posted on 4/25/19 at 1:34 pm to Green Chili Tiger

Posted on 4/25/19 at 1:37 pm to GumboPot
we use paper straws now so its all good anyway

Posted on 4/25/19 at 1:38 pm to Eighteen
quote:
we use paper straws now so its all good anyway
I started carrying around a Yeti straw in my back pocket
Posted on 4/25/19 at 1:42 pm to GumboPot
nah baw, we gotta guilt trip these white soccer moms into driving hybrids instead of Tahoes to cover up the fact that India, China, and Africa create far more pollution than the US.
Posted on 4/25/19 at 1:42 pm to fallguy_1978
quote:
I started carrying around a Yeti straw in my back pocket
I lol'd but they really do make those.

Posted on 4/25/19 at 1:43 pm to GumboPot
Yeah, but it functions sort of as a Ponzi scheme. Eventually, they won't be able to credibly do that. They already can't with the email gate, but man the left and the MSM are holding on for dear life.

Posted on 4/25/19 at 1:44 pm to GumboPot
That’s exactly what a racistsexisthomophobe would say you racistsexisthomophobe!
Posted on 4/25/19 at 1:46 pm to GumboPot
quote:
temperature data is manipulated to make it look like global warming is happening
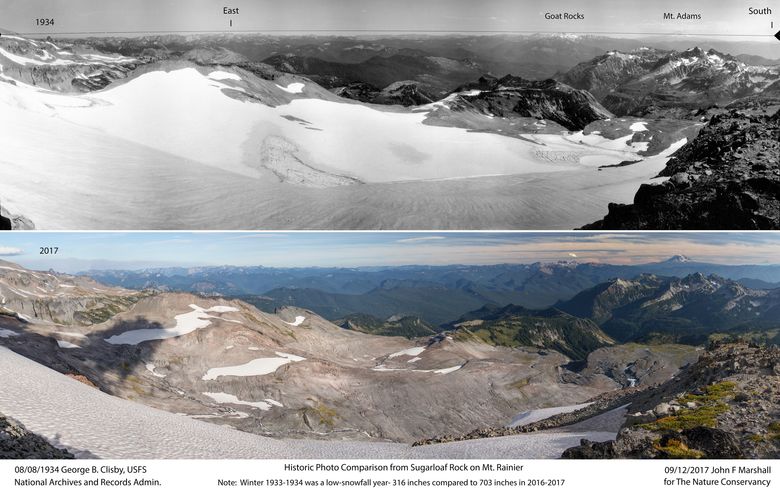
yeah and they fake pictures too...
Posted on 4/25/19 at 1:54 pm to MyNameIsNobody
You realize the 1934 picture is 32 days earlier in the summer than the 2017 picture? In other words the 2017 picture was exposed to 32 more summer days.
Posted on 4/25/19 at 1:55 pm to GumboPot
Also had half the snow than 2017.
This post was edited on 4/25/19 at 1:58 pm
Posted on 4/25/19 at 1:59 pm to MyNameIsNobody
They did it again in this photo too:

The 1934 photo is a picture of Anvil Rock taken 37 days into summer and the 2017 picture was taken 81 days into summer. Kind of a disingenuous comparison.
The 1934 photo is a picture of Anvil Rock taken 37 days into summer and the 2017 picture was taken 81 days into summer. Kind of a disingenuous comparison.
Posted on 4/25/19 at 1:59 pm to GumboPot
Climate change is the greatest scam of our time. Total bullshite
Posted on 4/25/19 at 2:01 pm to fightin tigers
quote:
Also had half the snow than 2017.
Snow does not accumulate on steep mountains as much as it does on flat lands and valleys FWIW, so that could/would be an irrelevant data point.

Posted on 4/25/19 at 2:02 pm to MyNameIsNobody
quote:
yeah and they fake pictures too...
LOL am I supposed to be concerned by this? Looks like a little more snow is melted?
Posted on 4/25/19 at 2:02 pm to GumboPot
There's some really good podcasts with Randall Carlson on climate change.
This post was edited on 4/25/19 at 2:03 pm
Posted on 4/25/19 at 2:03 pm to hubertcumberdale
quote:
Looks like a little more snow is melted?
Because it's many more days into the summer. Snow melts during summer months FWIW.

 Page 1 of 5

Back to top