- My Forums
- Tiger Rant
- LSU Recruiting
- SEC Rant
- Saints Talk
- Pelicans Talk
- More Sports Board
- Coaching Changes
- Fantasy Sports
- Golf Board
- Soccer Board
- O-T Lounge
- Tech Board
- Home/Garden Board
- Outdoor Board
- Health/Fitness Board
- Movie/TV Board
- Book Board
- Music Board
- Political Talk
- Money Talk
- Fark Board
- Gaming Board
- Travel Board
- Food/Drink Board
- Ticket Exchange
- TD Help Board
Customize My Forums- View All Forums
- Show Left Links
- Topic Sort Options
- Trending Topics
- Recent Topics
- Active Topics
Started By
Message
re: What is the income range for "middle class" per the board?
Posted on 9/27/17 at 3:58 pm to Tigerdev
Posted on 9/27/17 at 3:58 pm to Tigerdev
quote:Totally understandable.
a lifestyle issue. I like neighborhoods with character where i can walk places and be part of the community. I dont like "drive only" neighborhoods from a lifestyle perspective.
And. If I was 25 and felt that way, no way I'm buying a 1200sf house 40 minutes from work when I could instead, rent an apartment while working and eventually, buy something closer, or, maybe then I'd want a bigger something out there in the burbs(tastes change) or, maybe I finally buy a loft in the city.
Young people are a huge element of the "non" market driving away the cheaper homes of 1975.
 1
1


Posted on 9/27/17 at 3:59 pm to TigerFanatic99
quote:
I would call middle class to be $50,674 to $84,456. Sounds low, but middle class isn't as easy of a life as it was in the past.
Depends where you live too - middle class in Montgomery, Alabama isn't going to get even close to middle class in NYC.
Posted on 9/27/17 at 3:59 pm to Tigerdev
quote:
lifestyle issue. I like neighborhoods with character where i can walk places and be part of the community. I dont like "drive only" neighborhoods from a lifestyle perspective.
A lot of burbs are just extensions of the city itself
Posted on 9/27/17 at 4:03 pm to RogerTheShrubber
Ive lived in those burbs and enjoyed it. Arlington in north VA was like that. I could walk to Georgetown and work.
Posted on 9/27/17 at 4:04 pm to Taxing Authority
So. I just Zillowed
Under 500K
3BR
Min 1200SF
In NYC
And got 551 listings.
Only in NYC limits.
Under 500K
3BR
Min 1200SF
In NYC
And got 551 listings.
Only in NYC limits.
Posted on 9/27/17 at 4:05 pm to ShortyRob
quote:
Well, now we're down to individual anecdote. I mean, sure. If a person who can only earn X chooses for their own reasons, to move where things cost X + Y.......then they will find they can't afford X + Y.
But that isn't an economic discussion AND, it's not even a housing cost discussion. It's a life choices discussion.
Fair enough. This is probably thr closest to the argument I have been making.
Also, that given equal demand a vendor will always maximize profit margin, which for nicer, bigger houses is higher than smaller ones. However that shouldnt be misconstrued as a lack of demand for smaller houses.
Posted on 9/27/17 at 4:06 pm to ShortyRob
Its also driving up the prices in the city where we like to live.
Posted on 9/27/17 at 4:06 pm to Tigerdev
quote:Yep.
Its also driving up the prices in the city where we like to live.
Which goes to my point again.
Posted on 9/27/17 at 4:06 pm to ShortyRob
quote:
So. I just Zillowed
Under 500K
3BR
Min 1200SF
In NYC
And got 551 listings.
Only in NYC limits.
Couple of giant caveats...
How many have neighborhoods with bars on the windows?
How many have $1000+ common charges?
How many need $100k+ worth of work to get a certificate of occupancy?
Posted on 9/27/17 at 4:07 pm to skrayper
I make really good money on top of my military retirement and 90% VA disability. My wife is an RN with 20+ years of experience and she makes good money.
We have a house and acres in Oklahoma and a house in California. If we were trying to buy our house in California today, we wouldn't be able to because it would be too high. If we lived full time in Oklahoma, people there would consider us "rich"--so it's all relative.
We have a house and acres in Oklahoma and a house in California. If we were trying to buy our house in California today, we wouldn't be able to because it would be too high. If we lived full time in Oklahoma, people there would consider us "rich"--so it's all relative.
Posted on 9/27/17 at 4:07 pm to ShortyRob
Im not sure when or where you got under the impression i didnt understand some of the causes. Step on a tack this morning? :lol :
Posted on 9/27/17 at 4:09 pm to NYNolaguy1
quote:This is not actually an economic given.
Also, that given equal demand a vendor will always maximize profit margin, which for nicer, bigger houses is higher than smaller ones.
If I sell widgets and I can make basic, medium and advanced ones.
I sell in a market that largely can afford basic, slightly can afford medium and a few can afford advanced.
In THAT market, it is highly unlikely that my margins will be higher on the advanced widgets. In fact, it's quite likely that my best margins will be on the basic widgets.
Just sayin.........
I should read your post better.
But, frankly, there's no such thing as a housing market with equal demand across the price spectrum so I missed that element or your post
This post was edited on 9/27/17 at 4:10 pm
Posted on 9/27/17 at 4:13 pm to ShortyRob
quote:
In THAT market, it is highly unlikely that my margins will be higher on the advanced widgets. In fact, it's quite likely that my best margins will be on the basic widgets.
Right, but thats because your basic widget demand is larger than your advanced widget market.
If both were equal, which do you make?
Does that imply there is no demand for basic widgets?
Eta: got it
This post was edited on 9/27/17 at 4:14 pm

Posted on 9/27/17 at 4:13 pm to Tigerdev
quote:You cited 4 yrs, which is amidst recovery from the worst housing slump since the Great Depression. Put another way, nationally, home prices remain 10% lower than their highs in 2006.
You linked a time range from after the market normalized again. Normalized at the higher prices that is...
Here is the actual post-2006 picture in New Orleans:

Posted on 9/27/17 at 4:15 pm to ShortyRob
quote:
But, frankly, there's no such thing as a housing market with equal demand across the price spectrum so I missed that element or your post
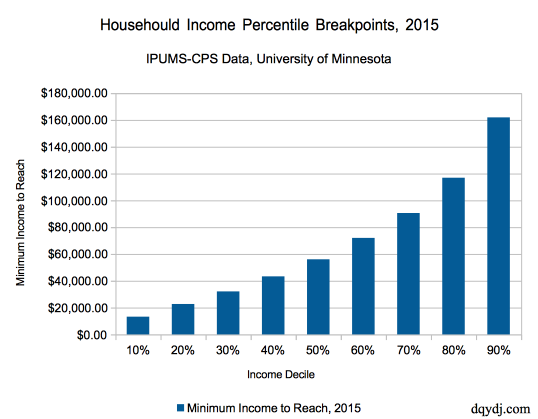
No, but it should match the income bar graph I posted on the first page. I think we agree it doesnt.
For clarity:
This post was edited on 9/27/17 at 4:19 pm
Posted on 9/27/17 at 4:17 pm to Tigerdev
quote:Let's look at facts, shall we?
What is your point exactly? My point is pretty clear.
quote:


The Census Bureau recently released its annual report on “Characteristics of New Housing” for 2014, which includes data on the average and median size of new homes and those data are displayed in the top chart above. Here are some details:
1. In 2014, the average size of new houses built increased to an all-time high of 2,690 square feet (see dark blue line in top chart), and the median size new home set a new record of 2,506 square feet (see light blue line in chart). Over the last 40 years, the average home has increased in size by more than 1,000 square feet, from an average size of 1,660 square feet in 1973 (earliest year available from Census) to 2,690 square feet last year. Likewise, the median-size home has increased in size by almost 1,000 square feet, from 1,525 square feet in 1973 to 2,506 last year. In percentage terms, the average home size has increased by 62% since 1973, while the median home size increased by 64%.
2. While the average size of a new US home has increased over the last 40 years, the average household size has been declining over that period, from 3.01 persons per household on average in 1973 to a new record low of 2.54 persons per household in the last two years (2013 and 2014), a reduction of almost one-half person per household over the last 40 years (see brown line in top chart).
LINK
quote:BTW: None of which addresses other quality issues. i.e., Granite Counters instead of Formica, or Tile instead of Linoleum, or Solid Brass/Nickel instead of chrome plating, or Finished 2 car garages instead of unfinished one-car garages, etc.

The National Association of Realtors’s monthly measure of housing affordability (based on the median price for existing-homes, median family income, and the current fixed rate for 30-year mortgages) displayed in the chart above also shows that purchasing a home today (new or existing) is more affordable today than the average affordability measure of 124 over the last 34 years. The current affordability index for April was 165, which means that a family earning the median annual income of $66,483 would have 165% of the qualifying income of $40,320 required to purchase the median-price home of $221,200 with a 20% down payment and a mortgage for the $176,960 balance, financed for 30-years at the 3.95% current mortgage rate. Housing affordability has averaged 124 over the last 41 years (median income was 124% of qualifying income), and was below 100 in the first part of the 1980s. Americans enjoy housing affordability today that is well above average for the post-1980 period, and twice as affordable as in the early 1980s.
Bottom Line: We hear all the time about stagnating household incomes, the decline of the middle class, rising income inequality, and lots of other narratives of gloom and doom for Americans. But when it comes to the new homes that Americans are buying and living in, we see a much brighter picture of life in the US. The new homes that today’s generation of homeowners are buying are larger by 1,000 square feet compared to the average new homes our parents or grandparents might have purchased in 1973, and have almost double the living space today adjusted for household size compared to 40 years ago.
And of course today’s new homes, compared to those built in the past, are much more energy-efficient; they come with better, bigger and more bathrooms, closets, and garages; they’re equipped with better and more home appliances; and they almost all include modern features like central air conditioning today that might have been expensive options in previous decades like the 1970s. Americans are paying about 62% more today for a median-priced new home on an inflation-adjusted basis compared to 1973, largely because the size of the median home has increased by more than 64%. So on an inflation-adjusted basis, we’re actually paying slightly less today for a new home on a per square-foot basis than in 1973. Overall, the increasing size, improving quality, and relative affordability of new (and existing) homes today means that living standards continue to gradually, but consistently, improve year after year for most Americans.
LINK
This post was edited on 9/27/17 at 4:19 pm
Posted on 9/27/17 at 4:25 pm to NC_Tigah
Posted on 9/27/17 at 4:27 pm to NC_Tigah
50 year high by 2016. Get out...
Posted on 9/27/17 at 4:35 pm to Tigerdev
quote:No.
50 year high.
Did you honestly read a NON-median one-year rate of increase that way?
Posted on 9/27/17 at 4:42 pm to NYNolaguy1
quote:why would it do that? I can actually can't imagine any economic scenario where that would be the case
No, but it should match the income bar graph I posted on the first page. I think we agree it doesnt.
You might expect it to match the income bar graph if the demographics of every bar were the same. But they're not. Some of the bars have young people who weren't that interested in a new home yet. Some of the bars have more people with children than others. I could go on. But the point is that no I would not expect demand to mirror the income bars. Not even close really. Does demand for high-end gaming computer consoles mirror income bars?

 Page 12 of 15

Back to top