- My Forums
- Tiger Rant
- LSU Recruiting
- SEC Rant
- Saints Talk
- Pelicans Talk
- More Sports Board
- Fantasy Sports
- Golf Board
- Soccer Board
- O-T Lounge
- Tech Board
- Home/Garden Board
- Outdoor Board
- Health/Fitness Board
- Movie/TV Board
- Book Board
- Music Board
- Political Talk
- Money Talk
- Fark Board
- Gaming Board
- Travel Board
- Food/Drink Board
- Ticket Exchange
- TD Help Board
Customize My Forums- View All Forums
- Show Left Links
- Topic Sort Options
- Trending Topics
- Recent Topics
- Active Topics
Started By
Message
re: Daily COVID Updated as of 11/2/20 8:00 PM
Posted on 7/30/20 at 1:25 pm to TigerDoc

Posted on 7/30/20 at 1:25 pm to TigerDoc
Meh...a country with a population of 47 million with 2700 cases/day and 2 deaths...If it's not herd immunity I'll take whatever that is.
WOM numbers already looking crappy...we'll see what Chrome's data tells us later.
WOM numbers already looking crappy...we'll see what Chrome's data tells us later.
This post was edited on 7/30/20 at 1:27 pm
 1
1

Posted on 7/30/20 at 3:01 pm to TigerDoc
Spain wasn't rocked with protests and riots, after locking down very, very early. If we knew what the true HIT was for COVID, which there's a pretty compelling (albeit unproven) argument that it's very low thanks to protection from previous corona infections, we'd have a better idea.
My guess is you have localized herd immunity in and around NYC, but certainly not statewide. However, the population of NY, NJ and CT is so concentrated in the Tristate Area, where you likely have that form of herd immunity, that the small outbreaks are specific to communities not around NYC. Look at Georgia, our reported cases are still high, but by the time you take into account backdating of cases instead of reporting date, the metro Atlanta counties are dropping like a rock while the state as a whole is still throwing up a ton of cases. I'm only making this statement based on data outside of the 14 day reporting window too.
My guess is you have localized herd immunity in and around NYC, but certainly not statewide. However, the population of NY, NJ and CT is so concentrated in the Tristate Area, where you likely have that form of herd immunity, that the small outbreaks are specific to communities not around NYC. Look at Georgia, our reported cases are still high, but by the time you take into account backdating of cases instead of reporting date, the metro Atlanta counties are dropping like a rock while the state as a whole is still throwing up a ton of cases. I'm only making this statement based on data outside of the 14 day reporting window too.
This post was edited on 7/30/20 at 3:04 pm
Posted on 7/30/20 at 3:02 pm to DMAN1968
To admin, I accidentally hit request admin instead of reply, I didn't mean to report DMAN's post, please disregard!
To DMAN, agreed, the death numbers look like shite today, but honestly expected given the lag of the curves. I was surprised the Georgia numbers were as low as they were though.
To DMAN, agreed, the death numbers look like shite today, but honestly expected given the lag of the curves. I was surprised the Georgia numbers were as low as they were though.
This post was edited on 7/30/20 at 3:03 pm
Posted on 7/30/20 at 6:21 pm to Chromdome35
This is the link to the COVID-19 tracker that I have created and shared on Google Drive.
If you want to view the shared sheet, follow this link COVID-19 Tracker
If you want to download a copy of this sheet and manipulate it follow this link Downloadable COVID-19 Tracker
The source for the data is from https://covidtracking.com/data/


New Cases by State

New Deaths by State

7-day average growth rate of new cases

If you want to view the shared sheet, follow this link COVID-19 Tracker
If you want to download a copy of this sheet and manipulate it follow this link Downloadable COVID-19 Tracker
The source for the data is from https://covidtracking.com/data/
New Cases by State
New Deaths by State
7-day average growth rate of new cases
Posted on 7/30/20 at 6:25 pm to Chromdome35
A fairly significant uptick in the positivity rate today on 819K tests. The US is averaging 5.7M tests a week.
VS last week, cases were down slightly, but deaths are up, both expected behaviors.
Pay close attention to the positivity rate over the next week. If it starts going up again, that won't be good at this volume of testing.
VS last week, cases were down slightly, but deaths are up, both expected behaviors.
Pay close attention to the positivity rate over the next week. If it starts going up again, that won't be good at this volume of testing.
Posted on 7/30/20 at 6:46 pm to Chromdome35
FYI -
I heard that Florida would not do testing from like Thursday to Tuesday b/c of the hurricane. If so, I suggest just assuming 9500 Florida cases (or whatever the 7 day average is) for Florida those days and do something similar with testing numbers. That way it doesn't affect the trends.
I heard that Florida would not do testing from like Thursday to Tuesday b/c of the hurricane. If so, I suggest just assuming 9500 Florida cases (or whatever the 7 day average is) for Florida those days and do something similar with testing numbers. That way it doesn't affect the trends.
Posted on 7/30/20 at 10:19 pm to Chromdome35
quote:This was a while back, but an epidemiologist on Twitter and an MD who wrote an OPED in one of the major publications (I think it may have been WSJ) pointed out a crude way to estimate trends in infections using cases and positivity. And it’s something we’ve discussed in here a few months ago. It may be something you would like to add to your chart.
Pay close attention to the positivity rate over the next week. If it starts going up again, that won't be good at this volume of testing.
Basically, the way to estimate is to: (1) take the number of cases (7 day moving average); (2) multiply by the positivity rate (7 day moving average), and this doesn’t seem necessary but they suggested (3) multiply that total by some coefficient (like 100) that is believed to estimate the true number of infections.
Again, #3 is a bit arbitrary but with or without (i.e., the coefficient would be 1) the comparison of trend would be the same
as long as that coefficient is constant as this provides an estimate and comparison of the relative spread.
Overall though, this means that if cases increase or decrease by some percentage but positivity rate is equal then the estimate of infections increased or decreased by the % change of cases. Similarly, if cases were equal but positivity rate increases or decreased by some percentage, the estimate of infections increased or decreased by the % change of the positivity rate.
As an example, let’s use the 7 day averages of today’s figures and last Thursday’s (07/23) but without step 3 and some more arbitrary coefficient.
07/23–66,887 cases*8.5% positivity rate=5685
07/30–63,879 cases*7.8% positivity rate=4983
That represents a 12.4% decrease week over week. So while cases decreased by 4.5%, because the lower positivity rate decreased by 8.2%, the estimate of infections decreased by 12.4%. On the other hand, back in April at the peak of the first wave (April 10t), cases were only around 31,111 per day but the positivity rate was pushing 19.2% So there were less than half as many cases as last Thursday, but because the positivity rate was so much higher, this method estimated the number of infections as about 5% in April.
Posted on 7/30/20 at 10:42 pm to buckeye_vol
I did this last week in response to someone asking about which states were having the most impact. I used the same math, I just did it for every state for that day.
In reading your post and thinking more about it, I think this could be a very good way to gauge the movements of the outbreak.
UPDATE: I took the data and calculated 7 Day Avg Cases * 7 Day Avg Positivity Rate for every day of the outbreak to date. Out of curiosity, I also calculated 7 Day Avg Deaths * 7 Day Avg Positivity Rate.
I'm naming these the PTI_Cases & PTI_Deaths.
This is very interesting, This is telling us is that the clear second wave wasn't as bad as the first.

Comparing the CTI to the 7 Day avg new cases, The early spike in the CTI is due to the very high positivity rate and low volume of testing that resulted from only testing symptomatic people in the early days of the outbreak. Once testing got to a sufficient volume (looks to be around Mid May) the two curves are very similar. Since 7 day avg cases is part of the CTI calculation it makes sense that any curve calculation based on it should closely follow. Therefore any variation in the curves is due to the positivity rate.

What does this tell us? I'm not really sure yet. It appears to be so closely tied to the 7 day avg cases curve that there isn't much need for both; however, if the lines start diverging or growing closer together, then we can use that change to gauge the impactfulness of movements.
In reading your post and thinking more about it, I think this could be a very good way to gauge the movements of the outbreak.
UPDATE: I took the data and calculated 7 Day Avg Cases * 7 Day Avg Positivity Rate for every day of the outbreak to date. Out of curiosity, I also calculated 7 Day Avg Deaths * 7 Day Avg Positivity Rate.
I'm naming these the PTI_Cases & PTI_Deaths.
This is very interesting, This is telling us is that the clear second wave wasn't as bad as the first.
Comparing the CTI to the 7 Day avg new cases, The early spike in the CTI is due to the very high positivity rate and low volume of testing that resulted from only testing symptomatic people in the early days of the outbreak. Once testing got to a sufficient volume (looks to be around Mid May) the two curves are very similar. Since 7 day avg cases is part of the CTI calculation it makes sense that any curve calculation based on it should closely follow. Therefore any variation in the curves is due to the positivity rate.
What does this tell us? I'm not really sure yet. It appears to be so closely tied to the 7 day avg cases curve that there isn't much need for both; however, if the lines start diverging or growing closer together, then we can use that change to gauge the impactfulness of movements.
This post was edited on 7/31/20 at 9:29 am
Posted on 7/31/20 at 9:12 am to Chromdome35
Thanks Chrome, for your continued efforts of presenting facts. I would say at the end of all this you should be awarded a Pulitzer Prize for scientific reporting, but given the current state of the press that would be damning you with very faint praise.
Posted on 7/31/20 at 9:31 am to DeCat ODahouse
You are welcome 
btw, I named the new metric/graph PTI for Political Talk Index.
btw, I named the new metric/graph PTI for Political Talk Index.
This post was edited on 7/31/20 at 10:19 am

Posted on 7/31/20 at 9:39 am to Chromdome35
I think that cases vs death chart of yours can definitely point to the fact that we were grossly underestimating how many people had this in the march/april time period and grossly overestimating how deadly it was as far as mortality rate.
This post was edited on 7/31/20 at 10:51 am
Posted on 7/31/20 at 10:46 am to GoCrazyAuburn
Florida overall seems to be improving to me. Most of the issues are in a couple counties. Cases down in other counties.
Posted on 7/31/20 at 5:19 pm to Chromdome35
This is the link to the COVID-19 tracker that I have created and shared on Google Drive.
If you want to view the shared sheet, follow this link COVID-19 Tracker
If you want to download a copy of this sheet and manipulate it follow this link Downloadable COVID-19 Tracker
The source for the data is from https://covidtracking.com/data/


New Cases by State
New Deaths by State
7-day average growth rate of new cases
If you want to view the shared sheet, follow this link COVID-19 Tracker
If you want to download a copy of this sheet and manipulate it follow this link Downloadable COVID-19 Tracker
The source for the data is from https://covidtracking.com/data/
New Cases by State
New Deaths by State
7-day average growth rate of new cases
Posted on 7/31/20 at 5:24 pm to Chromdome35
I do not like this upward movement of the Positivity Rate.

Testing was substantially down Week over Week, last Friday had 929K tests with an 8.1% positivity rate. Today was 718K tests with a 9.4% positivity rate.
Cases are still trending down, but if the positivity rate continues increasing, we're going to see the case curve turn upwards.
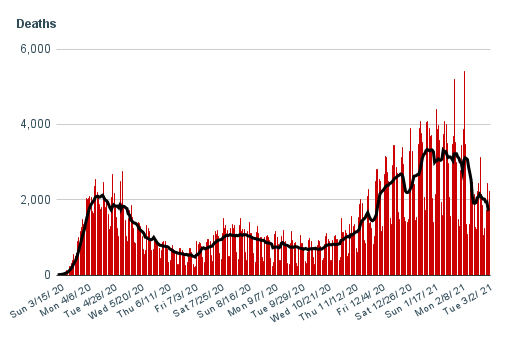
Deaths continue upward, the growth rate of deaths continues to climb. We probably have a couple more weeks of upward-moving deaths.
Testing was substantially down Week over Week, last Friday had 929K tests with an 8.1% positivity rate. Today was 718K tests with a 9.4% positivity rate.
Cases are still trending down, but if the positivity rate continues increasing, we're going to see the case curve turn upwards.
Deaths continue upward, the growth rate of deaths continues to climb. We probably have a couple more weeks of upward-moving deaths.
Posted on 7/31/20 at 5:33 pm to Chromdome35
Looking at the testing volume vs positivity rate you see that testing has taken a sharp decrease in the last few days at the same time it appears that the positivity rate is showing inverse behavior at the exact same time.
Very near term

Very near term
Posted on 7/31/20 at 5:44 pm to buckeye_vol
Buckeye,
Notice the uptick in the cases index today, The 7-day average new cases curve still shows downward movement, while the Index shows upward.

Foreshadowing?
Notice the uptick in the cases index today, The 7-day average new cases curve still shows downward movement, while the Index shows upward.
Foreshadowing?

Posted on 7/31/20 at 6:51 pm to Chromdome35
Chrome, positivity rate was 7.6% today
Minnesota had a data quirck
Minnesota had a data quirck
quote:
Nate Silver
@NateSilver538
Ahh, so there was a big data-reporting quirk in Minnesota that accounted for the high positive test rate. The real positive rest rate was ~7.6%, which is more in line with the slight improvement in recent days.

Posted on 7/31/20 at 6:52 pm to Chromdome35
quote:
I do not like this upward movement of the Positivity Rate
I read that's a quirk in Minnesota data and the positivity rate was 7.6% today.
ETA: HHTM was typing when I was apparently.
This post was edited on 7/31/20 at 6:54 pm
Posted on 7/31/20 at 7:54 pm to HailHailtoMichigan!
Oh how I wish there was consistent reliable data reporting...
Posted on 8/1/20 at 6:01 am to Chromdome35
Texas misreports 225 deaths due to an 'automation error.'

 Page 278 of 331

Popular
Back to top