- My Forums
- Tiger Rant
- LSU Recruiting
- SEC Rant
- Saints Talk
- Pelicans Talk
- More Sports Board
- Fantasy Sports
- Golf Board
- Soccer Board
- O-T Lounge
- Tech Board
- Home/Garden Board
- Outdoor Board
- Health/Fitness Board
- Movie/TV Board
- Book Board
- Music Board
- Political Talk
- Money Talk
- Fark Board
- Gaming Board
- Travel Board
- Food/Drink Board
- Ticket Exchange
- TD Help Board
Customize My Forums- View All Forums
- Show Left Links
- Topic Sort Options
- Trending Topics
- Recent Topics
- Active Topics
Started By
Message
re: Daily COVID Updated as of 11/2/20 8:00 PM
Posted on 7/28/20 at 5:44 pm to Crimsonians
Posted on 7/28/20 at 5:44 pm to Crimsonians
Definitely a good day. Big testing drop WOW, but the positivity rate being down by 1.2% from WOW is huge.
 0
0


Posted on 7/28/20 at 5:44 pm to Crimsonians
Could be a blip, but positivity rate down fairly significantly
Posted on 7/28/20 at 9:56 pm to HailHailtoMichigan!
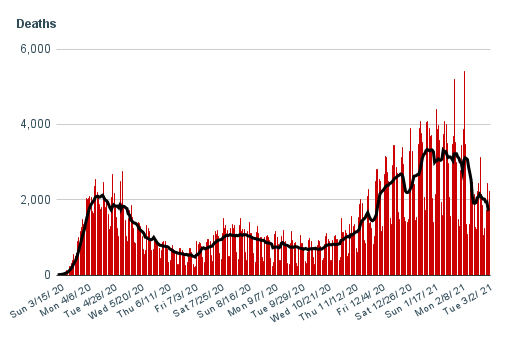
Wtf happened to the deaths today?
Posted on 7/28/20 at 10:08 pm to Mrtommorrow1987
Last Tuesday had 1054 deaths, today had 1121, a 6.4% increase over last week.
Given the upward trend of deaths as they follow 2-3 weeks behind the case curve, I think today is about where it should be. I'm happy the number wasn't higher.
Given the upward trend of deaths as they follow 2-3 weeks behind the case curve, I think today is about where it should be. I'm happy the number wasn't higher.
Posted on 7/28/20 at 11:26 pm to Chromdome35
quote:
Last Tuesday had 1054 deaths, today had 1121, a 6.4% increase over last week.
Given the upward trend of deaths as they follow 2-3 weeks behind the case curve, I think today is about where it should be. I'm happy the number wasn't higher.
I look in on this thread only now and then, so apologize if this has already been asked/answered.
The way you're reporting deaths, are you going by the count as reported on a particular day, or do your charts reflect deaths on the day they death was actually recorded?
To explain - I'll use Arizona for example. Something like half the deaths reported for AZ in July are from "death certificate matching," which means a) they're assumed COVID deaths (as opposed to tested/confirmed), and b) the death actually took place weeks ago ... as far back as March.
Thanks -
Posted on 7/28/20 at 11:46 pm to David_DJS
I believe that the data represents the count as reported on a particular day, your first premise.
I am not aware of any data source that shows the deaths adjusted to the actual date of death. Do you know of one?
I'm not the source of the data, I'm just downloading the dataset from the COVID Tracking Project daily and updating my sheet, so my stuff would be based on however their methodology works. WorldoMeter's number do differ some from the COVID Tracking Project, so every source is a bit different. Over time they all look the same graphically, no real difference.
This post was edited on 7/28/20 at 11:50 pm
Posted on 7/29/20 at 3:03 am to Chromdome35
Thanks for your reply.
I don’t know of an easy way to use what little real data is out there, but I’ll tell you way the state of AZ is doing. They release “daily stats” every morning that show the top line numbers - “1,834 confirmed cases and 133 COVID deaths” for example. But if you look at the charts they publish daily, the reported daily data is not reflected in them because they are going back and reclassifying deaths, and even in some cases COVID cases - do those “1,834 cases and 133 deaths” are found spread out o er an about 90 day period in the rear view mirror.
To graph accurately, you’d have to have their data file (they don’t post it) or scroll through their charts and note the deaths/cases by day, which of course is changing every day for all the days during the COVID period. And that’s before you deal with the non-COVID COVID deaths and double/triple counting cases.
It’s a mess, and probably by design. If they reported accurate data - “unique new cases and actual COVID deaths” on a daily basis, Arizona wouldn’t have gone through this so-called spike and second lockdown of certain businesses and gatherings.
I’m sure Arizona isn’t doing anything that’s not also being done in most other states, if not all of them. They’ve even figured out how to clown the hospitalization numbers.
Posted on 7/29/20 at 9:42 am to Chromdome35
I'm sure this has been addressed, but are there any models that include assumptions of people who have had the virus, but were never tested? The CDC estimates that number to be 6-24x known cases.
Posted on 7/29/20 at 9:42 am to Chromdome35
Do you have a link to the WoM data website?
Posted on 7/29/20 at 10:24 am to seawolf06
Posted on 7/29/20 at 3:48 pm to Chromdome35
I have been working on the sharing settings for the new State Dashboard tracker I am standing up. Please try to go to this link and let me know if it works.
https://docs.google.com/spreadsheets/d/1TEcFHKYJF0PYkXp5PFOStPIQ-asvxfsq7DZrEsrM1W0/edit?usp=sharing
https://docs.google.com/spreadsheets/d/1TEcFHKYJF0PYkXp5PFOStPIQ-asvxfsq7DZrEsrM1W0/edit?usp=sharing
Posted on 7/29/20 at 5:13 pm to Chromdome35
This is the link to the COVID-19 tracker that I have created and shared on Google Drive.
If you want to view the shared sheet, follow this link COVID-19 Tracker
If you want to download a copy of this sheet and manipulate it follow this link Downloadable COVID-19 Tracker
The source for the data is from https://covidtracking.com/data/


New Cases by State

New Deaths by State

7-day average growth rate of new cases

If you want to view the shared sheet, follow this link COVID-19 Tracker
If you want to download a copy of this sheet and manipulate it follow this link Downloadable COVID-19 Tracker
The source for the data is from https://covidtracking.com/data/
New Cases by State
New Deaths by State
7-day average growth rate of new cases
Posted on 7/29/20 at 8:55 pm to Chromdome35
Hope I’m not busting in here with a straight dumb A question, but, is there any general consensus as to what the mortality rate in the US is to date?
Posted on 7/29/20 at 8:58 pm to Crimsonians
I have issue with taken the data that is being released by test sites/hospitals/ state governments. The "books" have been proven time and time again to be largely inaccurate and sometimes just plain fraud.
Fuzzy Numbers at best.
Fuzzy Numbers at best.
Posted on 7/29/20 at 9:25 pm to MeatCleaverWeaver
As of today, the official mortality rate is 3.25%; however, I believe the real rate is around .55%

Posted on 7/29/20 at 9:29 pm to Chromdome35
quote:
I believe the real rate is around .55%
The trend line has been clearly dipping towards a "true" IFR of between about .35% to .75%. Your double nickel splits my range "guess" neatly in two.
This post was edited on 7/29/20 at 10:49 pm
Posted on 7/30/20 at 7:04 am to Ace Midnight
Isn’t .55 pretty bad?

Posted on 7/30/20 at 7:23 am to baybeefeetz
It depends on how many people get it. If it takes 70% community infection to get to herd immunity, that would be the deaths of about 1.27 million (330 million x .7 x .0055). The 1918 flu outbreak killed about 650K as a point of historical comparison. You've got diseases that have small outbreaks like SARS, MERS, Ebola, that are more fatal on an IFR basis, but more easily suppressed. This one is tough because of presymptomatic/asymptomatic spread and fairly high R0. .55% is about 5.5x as fatal as typical flu.
This post was edited on 7/30/20 at 7:30 am
Posted on 7/30/20 at 7:55 am to Chromdome35
I still don't believe the low numbers coming out of New York. It is about as trust worthy as numbers from communist china.
There is an effort to rebuild Cuomo's pathetic image.
There is an effort to rebuild Cuomo's pathetic image.

Posted on 7/30/20 at 7:59 am to TigerDoc
Florida and Arizona are getting close to the same case/per1m pop numbers as New York and New Jersey. It will be interesting to see if the deaths and new cases follow them in a similar manner.

 Page 276 of 331

Popular
Back to top