





 0
0






- My Forums
- Tiger Rant
- LSU Recruiting
- SEC Rant
- Saints Talk
- Pelicans Talk
- More Sports Board
- Fantasy Sports
- Golf Board
- Soccer Board
- O-T Lounge
- Tech Board
- Home/Garden Board
- Outdoor Board
- Health/Fitness Board
- Movie/TV Board
- Book Board
- Music Board
- Political Talk
- Money Talk
- Fark Board
- Gaming Board
- Travel Board
- Food/Drink Board
- Ticket Exchange
- TD Help Board
Customize My Forums- View All Forums
- Show Left Links
- Topic Sort Options
- Trending Topics
- Recent Topics
- Active Topics
Started By
Message
re: Daily COVID Updated as of 11/2/20 8:00 PM
Posted on 3/24/20 at 5:34 pm to Chromdome35
Posted on 3/24/20 at 5:34 pm to Chromdome35
Good.
Posted on 3/24/20 at 5:37 pm to the808bass
Pulling for him
Keep strong
Keep strong
Posted on 3/24/20 at 5:40 pm to LosLobos111
Thanks.
Posted on 3/24/20 at 6:18 pm to Chromdome35
This is the link to the COVID-19 tracker that I have shared on Google Drive. Chromdome's COVID-19 Daily Tracker
The source for the data is https://www.worldometers.info/coronavirus/
The source for the testing data is from https://covidtracking.com/data/
On the tracker sheet you will see tabs for the following data:
1) US Summary
2) Country Comparables: This shows you how the US stacks up vs. select other countries dealing with COVID-19
3) Italy Summary
4) UK Summary
5) France Summary
6) Germany Summary
If you would like a graph created that I don't have, just ask and if it's possible I will create it for you.
Due to space constraints on the PT board, I'm only posting a few graphs in the thread, if a consensus emerges of what graphs the PT wants to see in thread without having to go to the tracker, I will gladly change them up.
I am working to create a sheet that compares the US metrics to the other countries metrics. I'll let you all know when that's done and available.
NOTE: The daily growth rate data will not be accurate until the end of the day's postings. It will change throughout the day.
NOTE: I am not tracking individual states, I don't have a reliable consistent source for that data.
NOTE: I am not a mathematician, statistics guru, scientist, sharpest tack in the box, I'm just a guy who likes to understand for myself what is happening and to share it with others. This thread was not created to debate if you should or shouldn't take this seriously, it is simply to present the numbers and foster conversation.

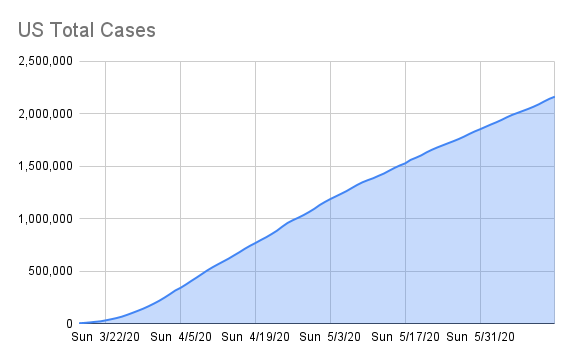



The source for the data is https://www.worldometers.info/coronavirus/
The source for the testing data is from https://covidtracking.com/data/
On the tracker sheet you will see tabs for the following data:
1) US Summary
2) Country Comparables: This shows you how the US stacks up vs. select other countries dealing with COVID-19
3) Italy Summary
4) UK Summary
5) France Summary
6) Germany Summary
If you would like a graph created that I don't have, just ask and if it's possible I will create it for you.
Due to space constraints on the PT board, I'm only posting a few graphs in the thread, if a consensus emerges of what graphs the PT wants to see in thread without having to go to the tracker, I will gladly change them up.
I am working to create a sheet that compares the US metrics to the other countries metrics. I'll let you all know when that's done and available.
NOTE: The daily growth rate data will not be accurate until the end of the day's postings. It will change throughout the day.
NOTE: I am not tracking individual states, I don't have a reliable consistent source for that data.
NOTE: I am not a mathematician, statistics guru, scientist, sharpest tack in the box, I'm just a guy who likes to understand for myself what is happening and to share it with others. This thread was not created to debate if you should or shouldn't take this seriously, it is simply to present the numbers and foster conversation.
Posted on 3/24/20 at 6:48 pm to Chromdome35
Looks like deaths will grow more today than the last two days.... if that's accurate.
Posted on 3/24/20 at 8:07 pm to Chromdome35
This is the link to the COVID-19 tracker that I have shared on Google Drive. Chromdome's COVID-19 Daily Tracker
The source for the data is https://www.worldometers.info/coronavirus/
The source for the testing data is from https://covidtracking.com/data/
On the tracker sheet you will see tabs for the following data:
1) US Summary
2) Country Comparables: This shows you how the US stacks up vs. select other countries dealing with COVID-19
3) Italy Summary
4) UK Summary
5) France Summary
6) Germany Summary
If you would like a graph created that I don't have, just ask and if it's possible I will create it for you.
Due to space constraints on the PT board, I'm only posting a few graphs in the thread, if a consensus emerges of what graphs the PT wants to see in thread without having to go to the tracker, I will gladly change them up.
I am working to create a sheet that compares the US metrics to the other countries metrics. I'll let you all know when that's done and available.
NOTE: The daily growth rate data will not be accurate until the end of the day's postings. It will change throughout the day.
NOTE: I am not tracking individual states, I don't have a reliable consistent source for that data.
NOTE: I am not a mathematician, statistics guru, scientist, sharpest tack in the box, I'm just a guy who likes to understand for myself what is happening and to share it with others. This thread was not created to debate if you should or shouldn't take this seriously, it is simply to present the numbers and foster conversation.

The source for the data is https://www.worldometers.info/coronavirus/
The source for the testing data is from https://covidtracking.com/data/
On the tracker sheet you will see tabs for the following data:
1) US Summary
2) Country Comparables: This shows you how the US stacks up vs. select other countries dealing with COVID-19
3) Italy Summary
4) UK Summary
5) France Summary
6) Germany Summary
If you would like a graph created that I don't have, just ask and if it's possible I will create it for you.
Due to space constraints on the PT board, I'm only posting a few graphs in the thread, if a consensus emerges of what graphs the PT wants to see in thread without having to go to the tracker, I will gladly change them up.
I am working to create a sheet that compares the US metrics to the other countries metrics. I'll let you all know when that's done and available.
NOTE: The daily growth rate data will not be accurate until the end of the day's postings. It will change throughout the day.
NOTE: I am not tracking individual states, I don't have a reliable consistent source for that data.
NOTE: I am not a mathematician, statistics guru, scientist, sharpest tack in the box, I'm just a guy who likes to understand for myself what is happening and to share it with others. This thread was not created to debate if you should or shouldn't take this seriously, it is simply to present the numbers and foster conversation.
Posted on 3/24/20 at 8:14 pm to Chromdome35
Wow, latest update from the worldometer site has the country over 200 for the first time and NY over 100 today. This isn't far from a disaster in NY.
Posted on 3/24/20 at 8:17 pm to Chromdome35
The day isn't over, so this could change, but today is the first day the mortality rate has increased.
The growth of deaths is outpacing the growth of new cases for the last three days.
Damn, worldometer updated RIGHT after I posted. I updated the spreadsheet, I won't update the data table until after the end of the day for WoM.
The growth of deaths is outpacing the growth of new cases for the last three days.
Damn, worldometer updated RIGHT after I posted. I updated the spreadsheet, I won't update the data table until after the end of the day for WoM.
This post was edited on 3/24/20 at 8:19 pm
Posted on 3/24/20 at 8:18 pm to Arch Madness
quote:We’re still probably 2 weeks at the earliest before it hits its peak, which could be anywhere from 3 to 5 thousand deaths per day.
219 deaths at 9pm....going to be a tough couple of days if this thing gets any worse
Posted on 3/24/20 at 8:33 pm to Arch Madness
hopefully the "muh flu" people finally shut the frick up and frick off.
220/day annualized is 72k/year, higher than the 12-60k range from seasonal flu and there are only 50k people infected instead of the 35 million that get the flu annually, and only more people would get infected from this if we did nothing
220/day annualized is 72k/year, higher than the 12-60k range from seasonal flu and there are only 50k people infected instead of the 35 million that get the flu annually, and only more people would get infected from this if we did nothing
Posted on 3/24/20 at 8:39 pm to buckeye_vol
quote:
which could be anywhere from 3 to 5 thousand deaths per day.
Wtf?????
That would put our mortality rate very similar to italy’s.
3000 deaths per day here is equivalent to 545 deaths in Italy. Which is about what we are seeing there
Posted on 3/24/20 at 8:41 pm to buckeye_vol
With 775 deaths nationwide in 3 weeks from this type coronavirus, how does this compare with the estimate of 22,000 deaths nationwide from seasonal flu between 10/1/19 and 3/1/20? That’s 22,000 deaths in 5 months, or 21 weeks and looks to me north of 1000 per week DEAD of seasonal flu in the U.S. About 3000 in 3 weeks for seasonal flu on average and we’re dealing with 775 deaths in the first 3 weeks of March 2020 from Chinese flu. Do I have this wrong? Just sayin’.
Posted on 3/24/20 at 8:43 pm to beachdude
50k infected vs. 35 million infected
Posted on 3/24/20 at 8:45 pm to Tiguar
quote:
50k infected vs. 35 million infected
Does your 35 million include asymptomatic?
Posted on 3/24/20 at 8:45 pm to Tiguar
How high will the CFR rate go up from where it currently is?
Posted on 3/24/20 at 8:49 pm to HailHailtoMichigan!
According to Boatshoes who’s been tracking it daily on his own he has CFR at 1.2% and it’s was decreasing each day.
I believe 808bass said he believes it could end up 2-4% that was his guess.
I believe 808bass said he believes it could end up 2-4% that was his guess.
Posted on 3/24/20 at 8:50 pm to Magician2
2-4 is a damn big range
Posted on 3/24/20 at 8:51 pm to Magician2
I still cant put a whole lot of stock in that number. People who dont show serious symptoms arent getting tested with any measurable frequency
Posted on 3/24/20 at 8:52 pm to Magician2
your argument is wholly irrelevant because the death counts from flu are counted in the same manner.
bottom line is we know there are 50k cases. Those 220 that died today were sick and probably positive a week ago when there were 20k cases. This isn’t the flu.
bottom line is we know there are 50k cases. Those 220 that died today were sick and probably positive a week ago when there were 20k cases. This isn’t the flu.
Posted on 3/24/20 at 8:56 pm to Chromdome35
I don’t like the new mortality chart. Change it back.

 Page 63 of 331



Popular

Back to top
 Follow TigerDroppings for LSU Football News