




 1
1






- My Forums
- Tiger Rant
- LSU Recruiting
- SEC Rant
- Saints Talk
- Pelicans Talk
- More Sports Board
- Fantasy Sports
- Golf Board
- Soccer Board
- O-T Lounge
- Tech Board
- Home/Garden Board
- Outdoor Board
- Health/Fitness Board
- Movie/TV Board
- Book Board
- Music Board
- Political Talk
- Money Talk
- Fark Board
- Gaming Board
- Travel Board
- Food/Drink Board
- Ticket Exchange
- TD Help Board
Customize My Forums- View All Forums
- Show Left Links
- Topic Sort Options
- Trending Topics
- Recent Topics
- Active Topics
Started By
Message
re: Daily COVID Updated as of 11/2/20 8:00 PM
Posted on 3/23/20 at 5:17 pm to Chromdome35
Posted on 3/23/20 at 5:17 pm to Chromdome35
it doesn't look flat to me
Posted on 3/23/20 at 5:29 pm to ApexTiger
WoM showing a slight increase in infected/deaths ratio, higher than yesterday. 132 deaths so far on the day.
This post was edited on 3/23/20 at 5:30 pm
Posted on 3/23/20 at 5:43 pm to NYNolaguy1
China stats showing no new cases OR new deaths.
I don’t buy it. Seems more likely they’re just not reporting numbers anymore.
I don’t buy it. Seems more likely they’re just not reporting numbers anymore.
Posted on 3/23/20 at 6:37 pm to flomacanes
My acupuncturist is from China. She is also a best seller author. All of her family is still there, some near Wuhan. From her:
Doctors are no longer allowed to test for CV. If they do, prison. The government is the only allowable entity to test for CV. The government will no longer test anyone for CV.
China has no more cases of CV. The ones being reported are false numbers made up by the government.
China is Asshoe
Doctors are no longer allowed to test for CV. If they do, prison. The government is the only allowable entity to test for CV. The government will no longer test anyone for CV.
China has no more cases of CV. The ones being reported are false numbers made up by the government.
China is Asshoe
Posted on 3/23/20 at 6:39 pm to Chromdome35
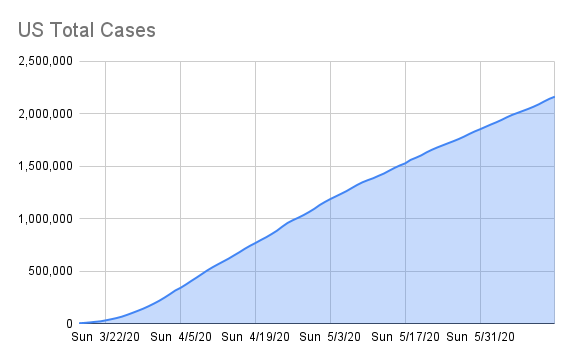
I have added more data to the Google Sheet, Check out the Country Comparables Tab.




Posted on 3/23/20 at 6:54 pm to Chromdome35
Thanks again for putting out the numbers. It might have changed since you put up the graphs but WoM is showing 132 deaths on the day, a few minutes before midnight GMT, totaling 545 deaths overall.
This post was edited on 3/23/20 at 6:55 pm
Posted on 3/23/20 at 8:27 pm to TideCPA
quote:
I know it's been said plenty of times, but wanted to reiterate as it appears the official mortality rate is leveling off at 1.2%: the mortality rate in the US is, and will continue to be, artificially high.
Definitely agreed, but I think people should prepare for the CFR to eventually go back up again, as case-growth slows down and deaths from older cases are allowed to catch up. We saw this in China, and we also saw this in Korea, and it's just common sense as well. So people should be aware that once new cases start leveling off, the mortality rate will start going back up, but the true mortality will actually still be under 1% more than likely, as long as hospitals don't get overwhelmed.
Posted on 3/23/20 at 8:54 pm to frogglet

Some numbers from the WoM site as of midnight GMT.
I adjusted down my death trend 2 a few notches to better capture the current US deaths slope from 3/17 going forward.
Regarding Italy it looks like they are at the peak or approaching it if they aren't there already. OTOH for the US nationally the daily log growth for deaths/day has held steady at a rough average of 131%/day since 3/18 for the US, while average growth is about 132%/day for new cases, slightly outpacing deaths.
Again keep in mind the trends shown are just the current line slopes going forward based on data recorded from the WoM, and most definitely not projections.
As always things can and will change for better or worse as this goes on.
eta: Added the CYA note of "most definitely not projections".
This post was edited on 3/23/20 at 9:04 pm
Posted on 3/23/20 at 9:11 pm to NYNolaguy1
Can you explain what exactly this graph means for the USA? Are we still a couple weeks away from peaking? Or not as far maybe?
Posted on 3/23/20 at 9:15 pm to Eat Your Crow
quote:
Can you explain what exactly this graph means for the USA?
It's just a measure of current growth rate in cases and deaths, i.e. if nothing changes between now and the end of the month and rates stay current, this is what to expect in terms of number of deaths and cases. In other words this is looking mostly backward a little forward given current rates.
quote:
Are we still a couple weeks away from peaking? Or not as far maybe?
That's way above my pay grade. I have no idea. I certainly hope so.
Posted on 3/23/20 at 9:18 pm to Eat Your Crow
I think because we’re more spread out that we will see individual outbreaks which keep us from “peaking” as a nation while the locations will have peaked.
New York accounts for half of all new cases today and close to half of total cases.
New York accounts for half of all new cases today and close to half of total cases.
Posted on 3/23/20 at 9:24 pm to the808bass
quote:
New York accounts for half of all new cases today and close to half of total cases.
Ironically, and perhaps unsurprisingly New Orleans also apparently has a hot growth rate at the moment, but unfortunately I haven't been able to verify that using any specific set of numbers.
Posted on 3/23/20 at 9:45 pm to NYNolaguy1
quote:The Johns Hopkins data set shows strong growth for N.O.
New Orleans also apparently has a hot growth rate at the moment, but unfortunately I haven't been able to verify that using any specific set of numbers
LINK
This post was edited on 3/23/20 at 9:45 pm
Posted on 3/23/20 at 9:48 pm to Chromdome35
Chromdome’s COVID19 tracker
I realized I had the sheet so locked down no one could see the other tabs of data. Check it out and let me know what you want to see.
I realized I had the sheet so locked down no one could see the other tabs of data. Check it out and let me know what you want to see.
Posted on 3/23/20 at 9:57 pm to Chromdome35
quote:
Chromedome35
I don’t post much here, as I tend to be more liberal than most here would like, but just wanted to say I appreciate the work you’re doing. I find it incredibly informative and helpful.
To the rest of the pt folks, y’all stay healthy and safe. Strange times we are in
Posted on 3/23/20 at 10:08 pm to gumpinmizzou
Thank you Gump! I appreciate the kind words.
Posted on 3/23/20 at 10:16 pm to Asharad
quote:
The Johns Hopkins data set shows strong growth for N.O.
This might be classic user error, but I can't seem to pull up a day by day graph/chart of cases in Louisiana or New Orleans from the JH website. I see overall cases but the graph is showing nationwide totals.
Posted on 3/23/20 at 10:21 pm to Chromdome35
Brother, when was this last updated?
Posted on 3/23/20 at 10:29 pm to Chromdome35
Chrome D- not asking you to study more, and I am sure that it could have been posited in the past 60 pages, but isn't one of the most hopeful signs the new daily confirmed CV cases?
We've have a five day lag w test results, w/ an increased supply of tests per day, so if pandemic gonna pandemic exponential, then NV cases should be way up. So if today is not double yesterday or worse, then these are positive signs, right?
We've have a five day lag w test results, w/ an increased supply of tests per day, so if pandemic gonna pandemic exponential, then NV cases should be way up. So if today is not double yesterday or worse, then these are positive signs, right?
Posted on 3/23/20 at 10:34 pm to PhDoogan
What are N.V. cases??

 Page 58 of 331



Popular

Back to top
 Follow TigerDroppings for LSU Football News